2. Introduction to OpenRefine
This Introduction to OpenRefine was developed by Owen Stephens (owen@ostephens.com) on behalf of the British Library in July 2014.
This work is licensed under a Creative Commons Attribution 4.0 International License http://creativecommons.org/licenses/by/4.0/.
It is suggested when crediting this work, you include the phrase Developed by Owen Stephens on behalf of the British Library
2.1. Getting Started
2.1.1. What is OpenRefine?
OpenRefine is described as a tool for working with messy data - but what does this mean? It is probably easiest to describe the kinds of data OpenRefine is good at working with and the sorts of problems it can help you solve.
OpenRefine is most useful where you have data in a simple tabular format but with internal inconsistencies either in data formats, or where data appears, or in terminology used. It can help you:
- Get an overview of a data set
- Resolve inconsistencies in a data set
- Help you split data up into more granular parts
- Match local data up to other data sets
- Enhance a data set with data from other sources
Some common scenarios might be:
- Where you want to know how many times a particular value appears in a column in your data
- Where you want to know how values are distributed across your whole data set
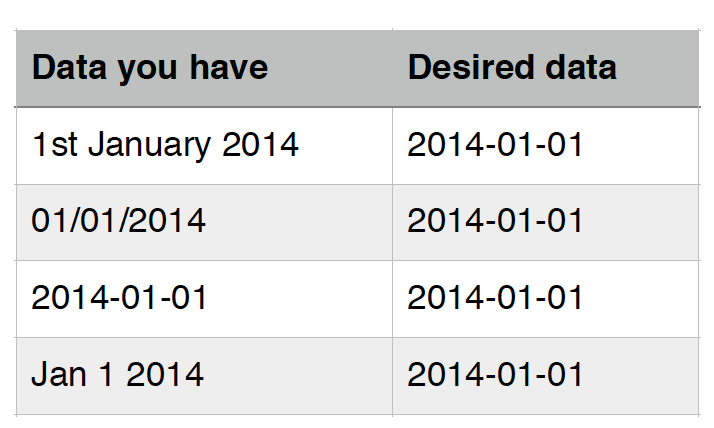
- Where you have a list of dates which are formatted in different ways, and want to change all the dates in the list to a single common date format:
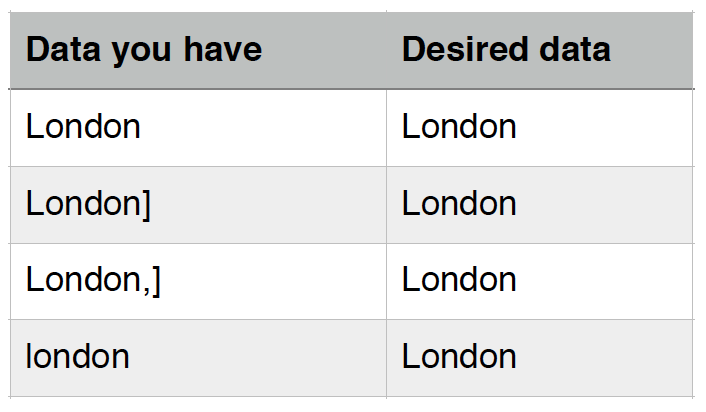
- Where you have a list of names or terms that differ from each other but refer to the same people, places or concepts:
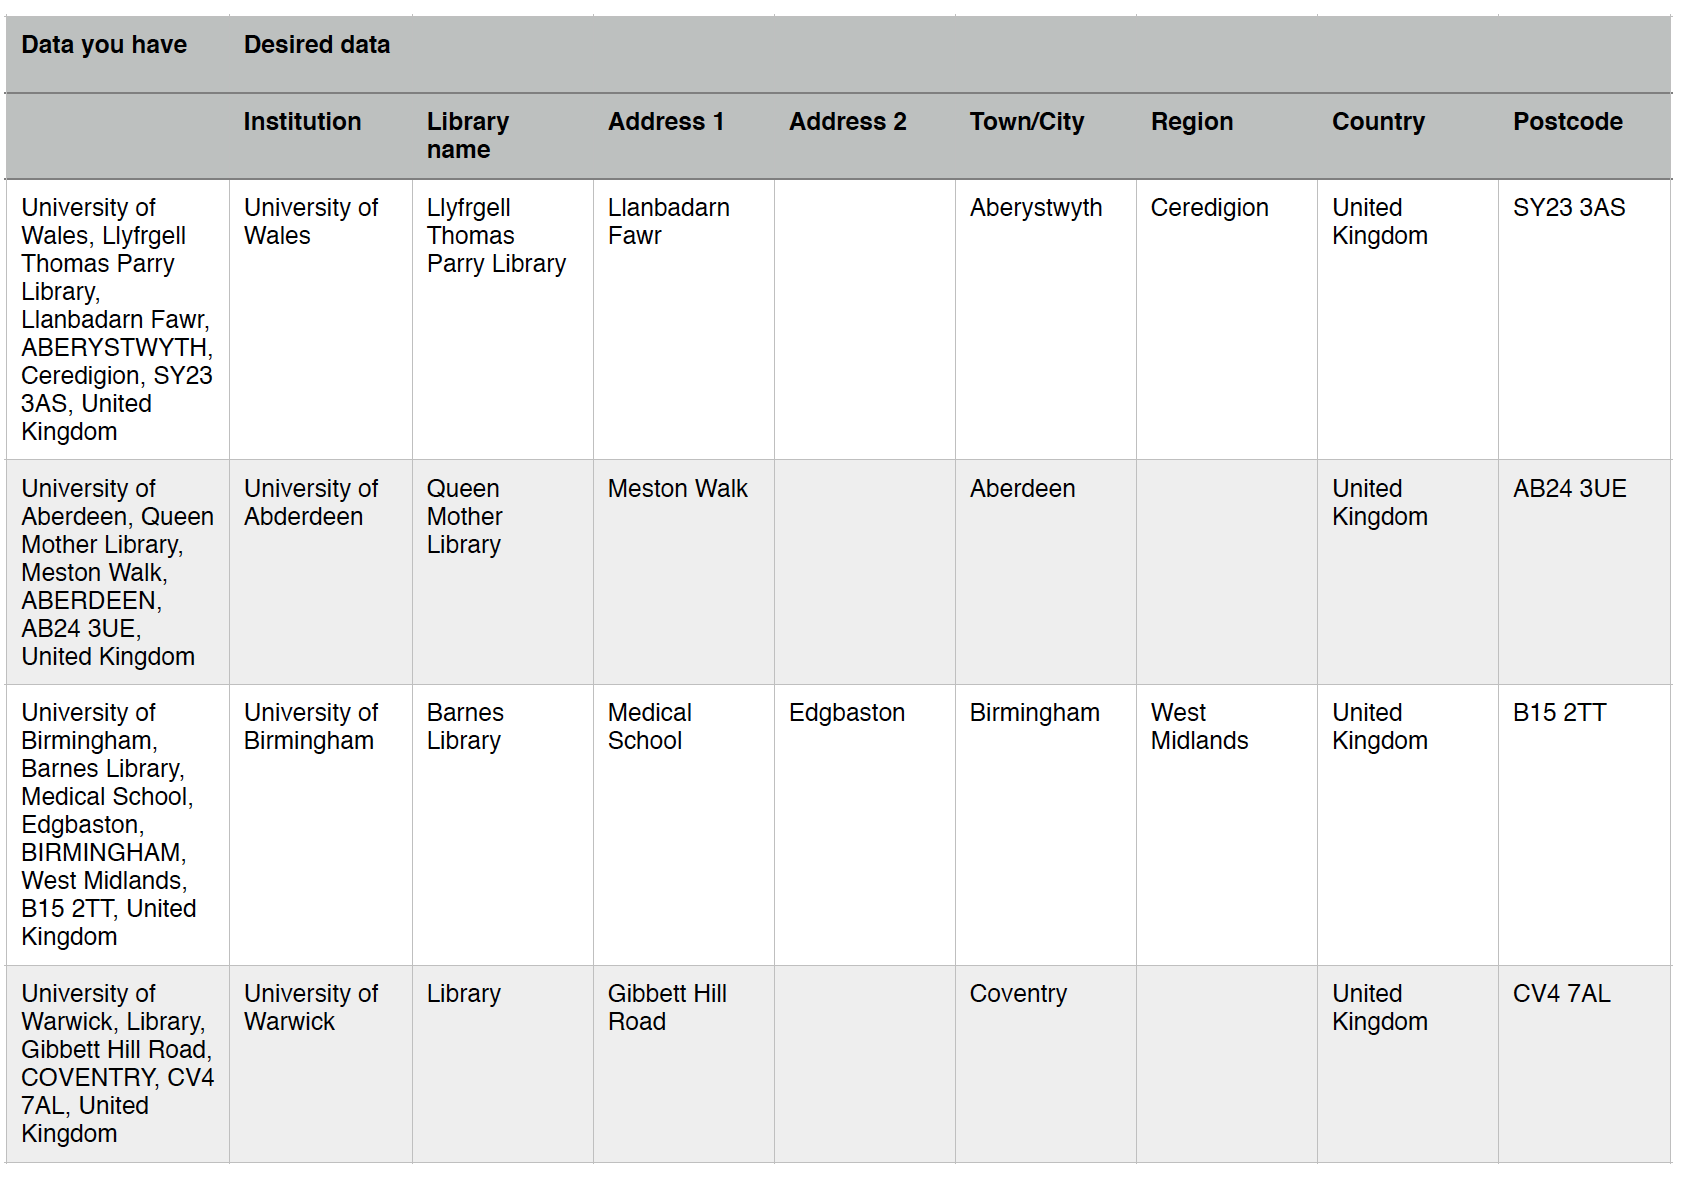
- Where you have several bits of data combined together in a single column, and you want to separate them out into individual bits of data with one column for each bit of the data:
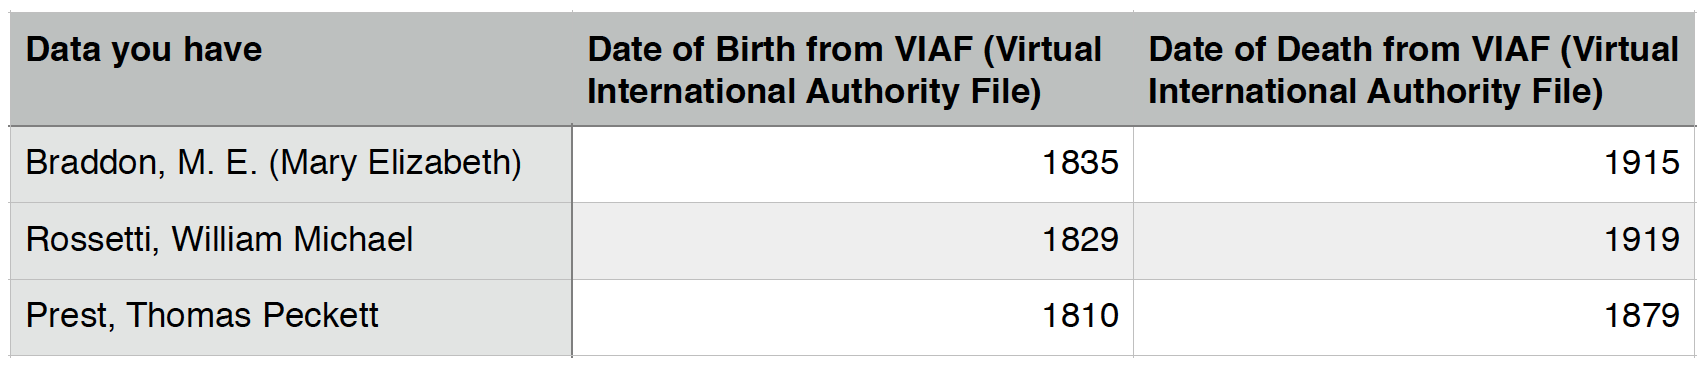
- Where you want to add to your data from an external data source:
2.1.2. Downloading OpenRefine
You can download OpenRefine from http://openrefine.org/download.html
While the current (as of 10th July 2014) official stable version is called Google Refine 2.5, generally the OpenRefine 2.6 - Development version is recommended over this and although labelled beta has been stable for some time.
There are versions for Windows, Mac OS X and Linux.
2.1.3. Installing and Running OpenRefine
When you download OpenRefine for Windows or Linux from the address above, you are downloading a zip file. To install OpenRefine you simply unzip the downloaded file wherever you want to install the program. This can be to a personal directory or to an applications or software directory - OpenRefine should run wherever you put the unzipped folder.
If you are downloading OpenRefine for Mac, you a re downloading a dmg (disk image) file which you can open, and then drag the OpenRefine application to an appropriate folder on you computer.
OpenRefine is a java application, and you need to have a java runtime environment (JRE) installed on your computer to run OpenRefine. If you don*t already have one installed then you can download and install from http://java.com by going to the site and clicking Free Java Download.
To run Refine:
- On Windows: Navigate to the folder where you*ve installed OpenRefine and either double-click google-refine.exe (for Google Refine 2.5), openrefine.exe (for OpenRefine 2.6) or refine.bat (for either)
- On Linux: Navigate to the folder where you*ve installed
OpenRefine in a terminal window and type
./refine - On Mac: Navigate to where you installed OpenRefine and click the OpenRefine icon
The interface to OpenRefine is accessed via a web browser. When you run Refine normally this should open a window in your default web browser pointing at the address http://127.0.0.1:3333. If this doesn*t happen automatically you can open a web browser and type in this address.
2.1.4. Getting Help
You can find support, documentation and tutorials on using OpenRefine in various places online including:
- The OpenRefine Wiki
- The Free your metadata site
- The OpenRefine mailing list and forum
Exercise 1: Create your first Open Refine project (using provided data)
There are several options for getting your data set into OpenRefine. You can upload or import files in a variety of formats including:
- TSV (tab-separated values)
- CSV (comma-separated values)
- Excel
- JSON (javascript object notation)
- XML
- Google Spreadsheet
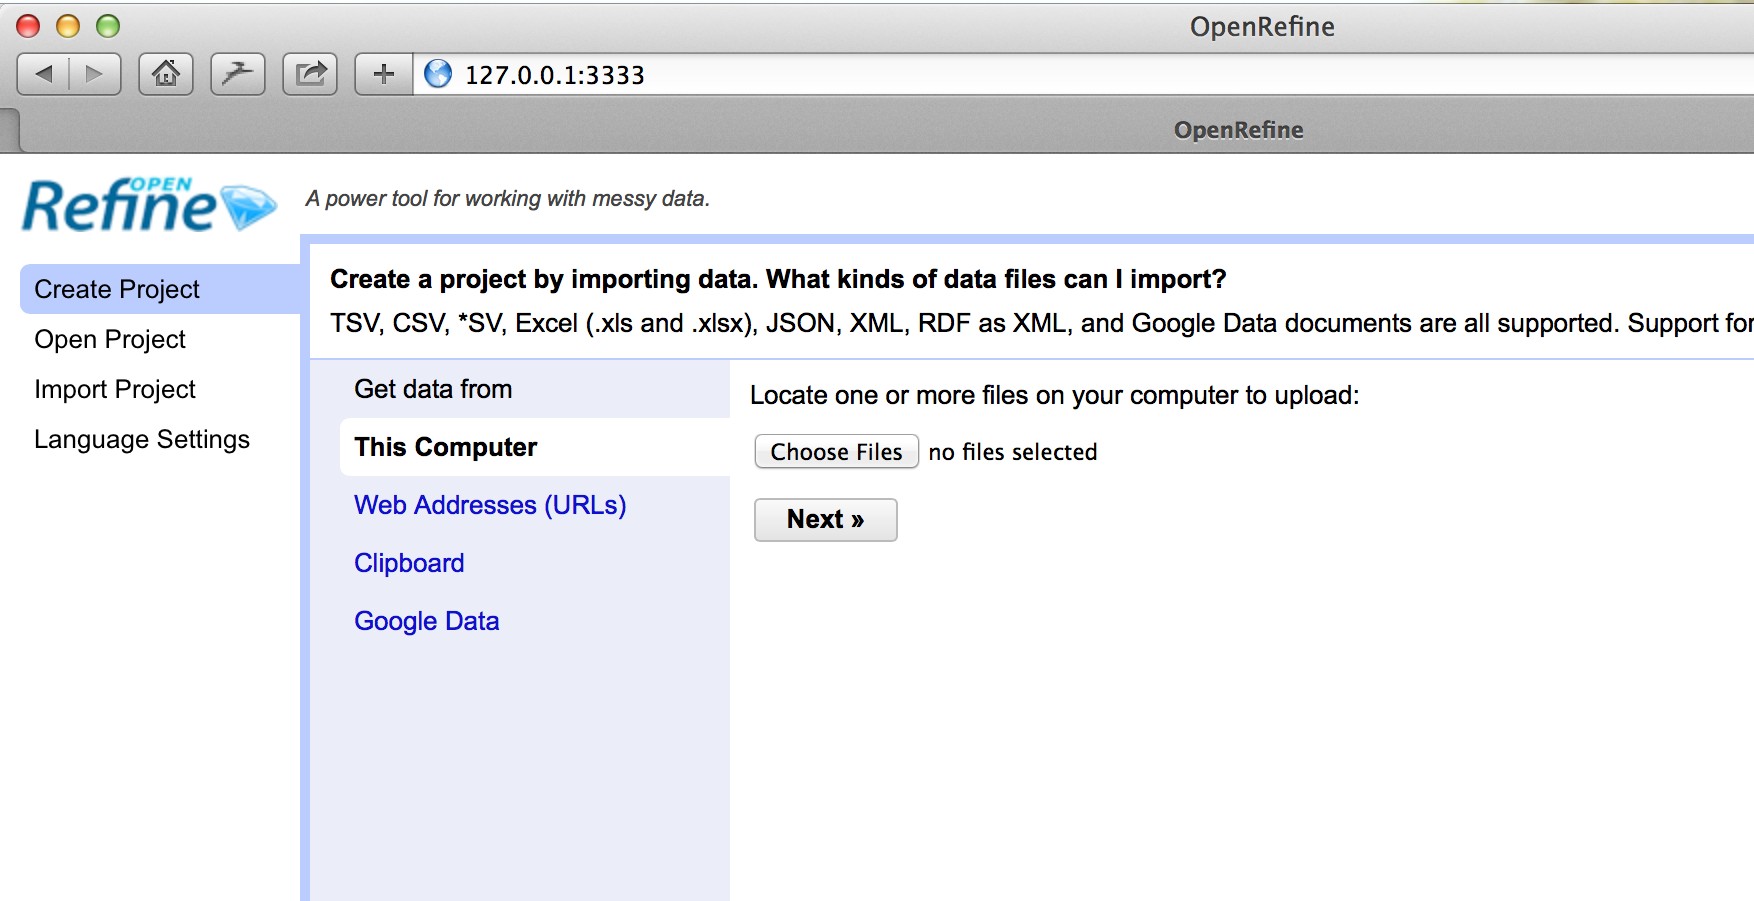
To import the data for the exercises below, run OpenRefine and:
- Click Create Project
- Choose Get Data from this Computer
- Click Choose Files
- Locate the file called BL-Flickr-Images-Book-subset.csv (this can be downloaded from this link
- Click Next
You should see a screen as follows:
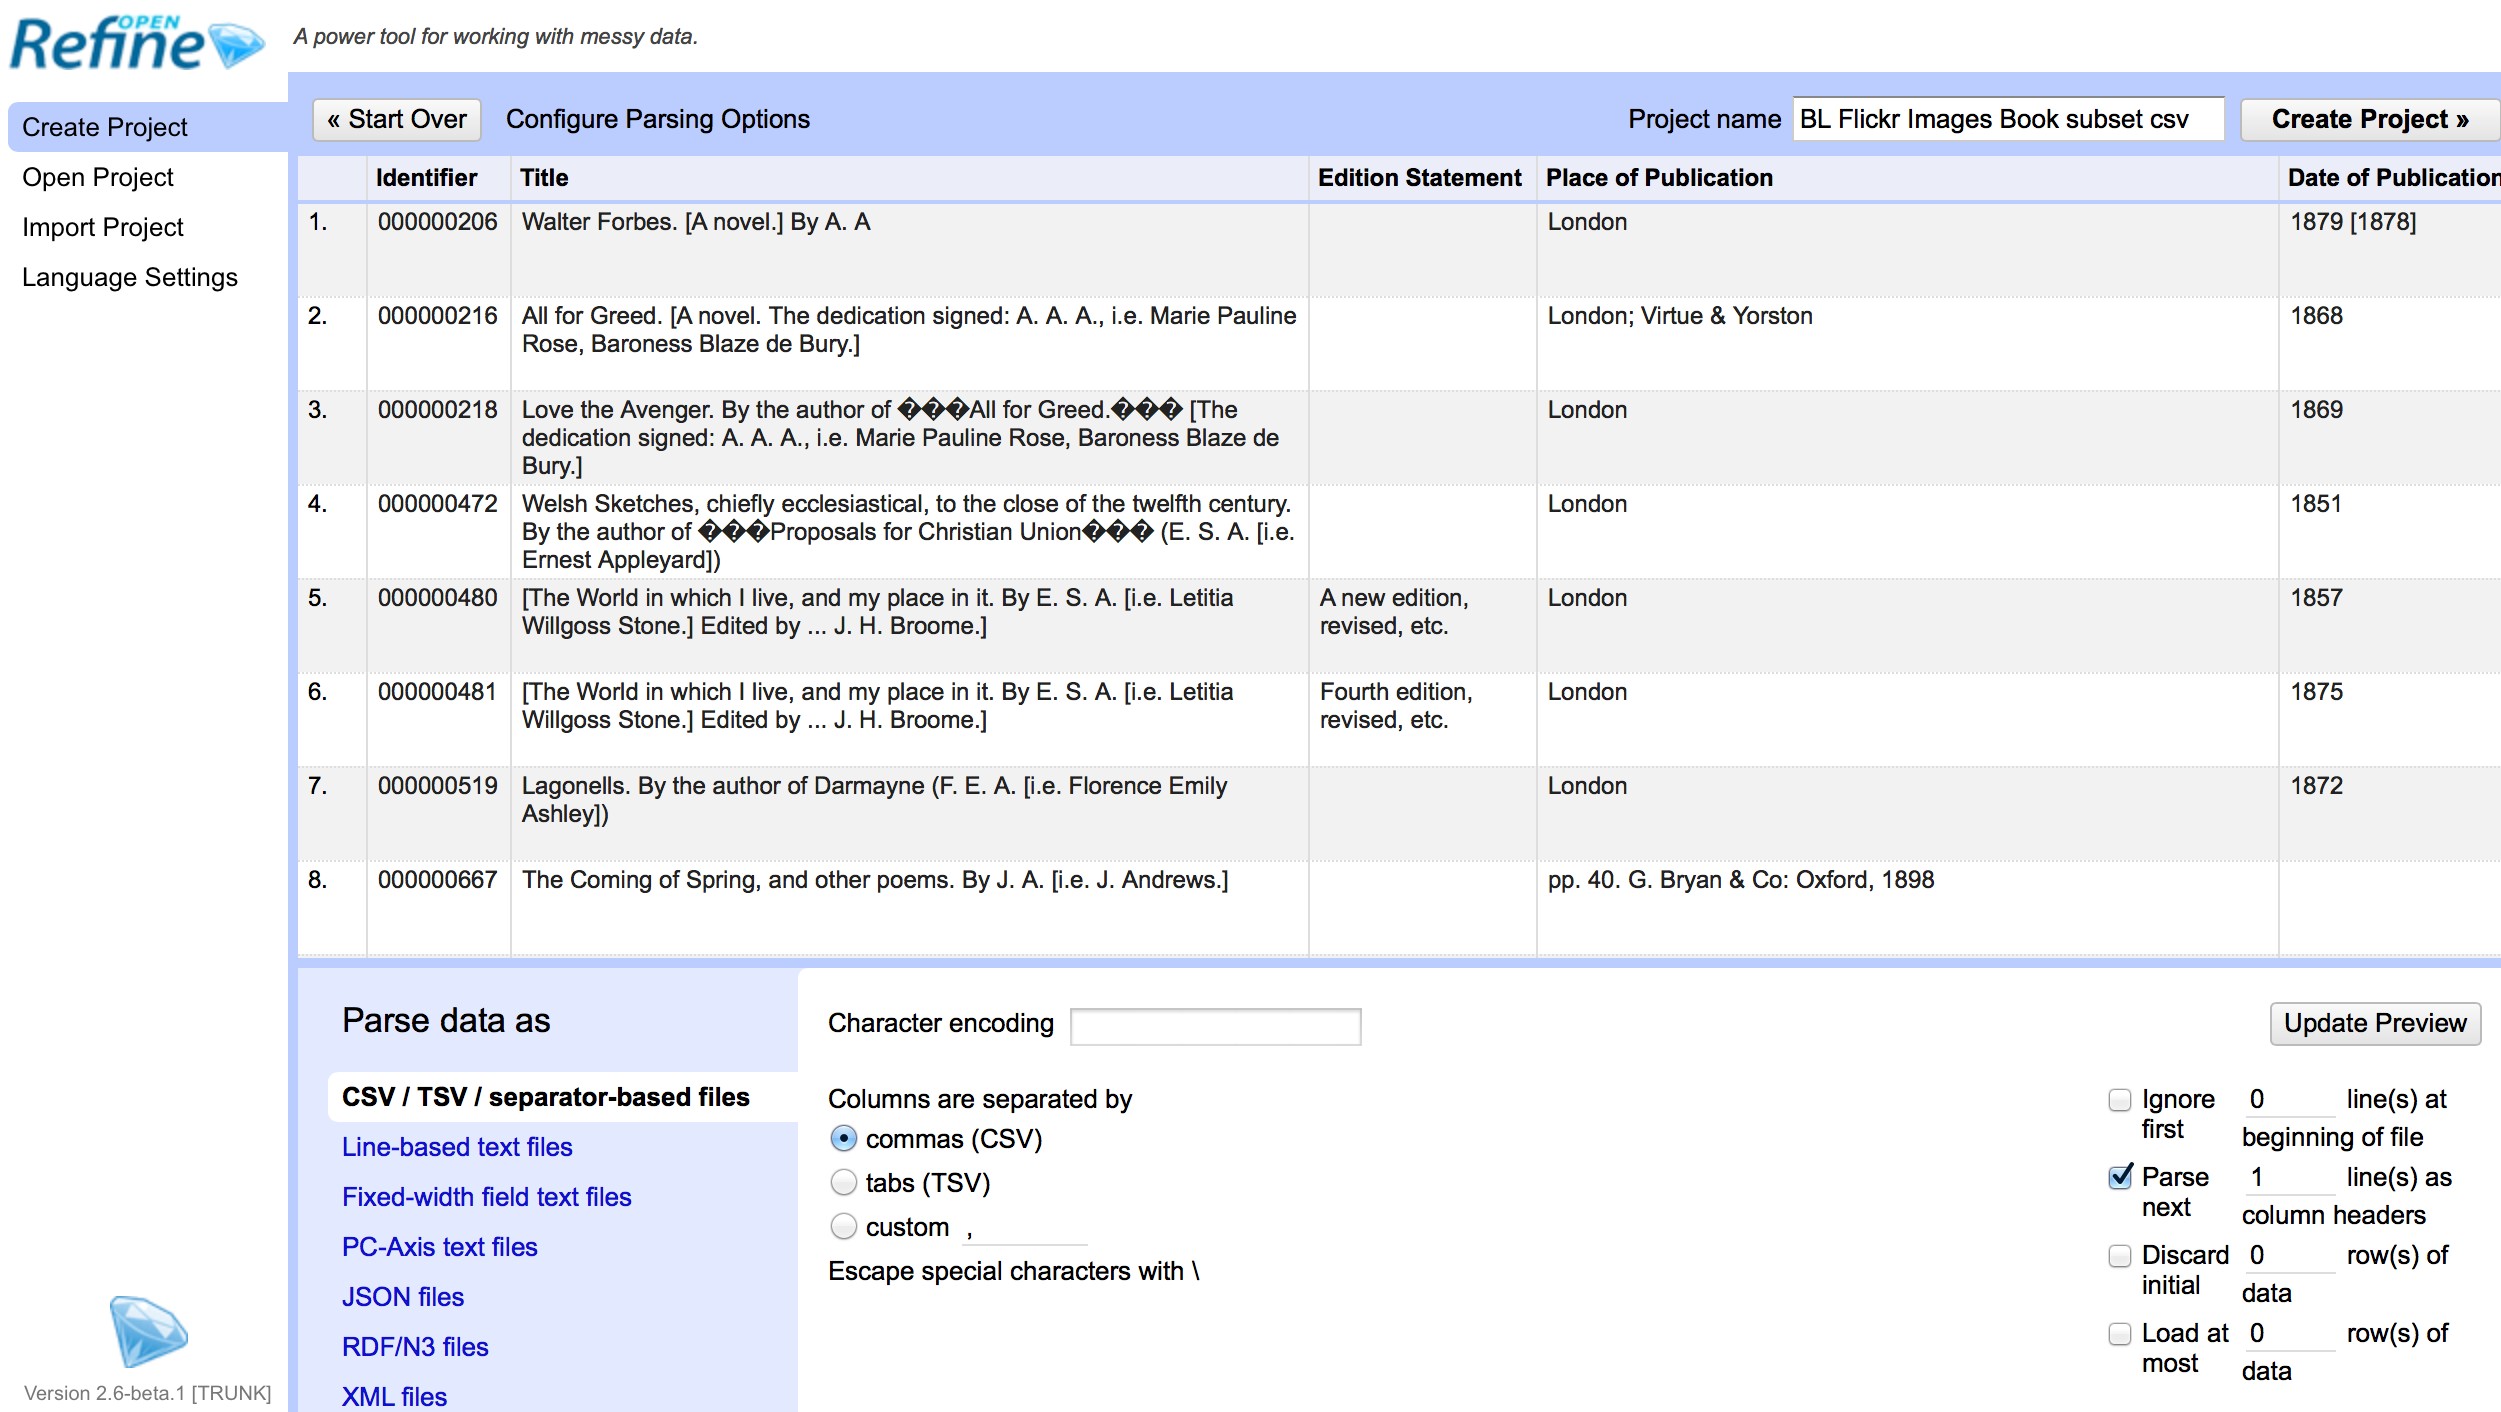
This screen gives you some options to ensure that the data gets imported into OpenRefine correctly. The options vary depending on the type of data you are importing.
In this case you need to:
- Set the Character encoding to UTF-8
- Ensure the first row is used to create the column headings
- Make sure OpenRefine doesn*t try to automatically detect numbers and dates Once you are happy click Create Project >>
This will create the project and open it for you. Projects are saved as you work on them, there is no need to save copies as you go along.
To open an existing project in OpenRefine you can click Open Project from the main OpenRefine screen (in the lefthand menu). When you click this, you will see a list of the existing projects and can click on a project*s name to open it.
2.2. Basic OpenRefine Functions
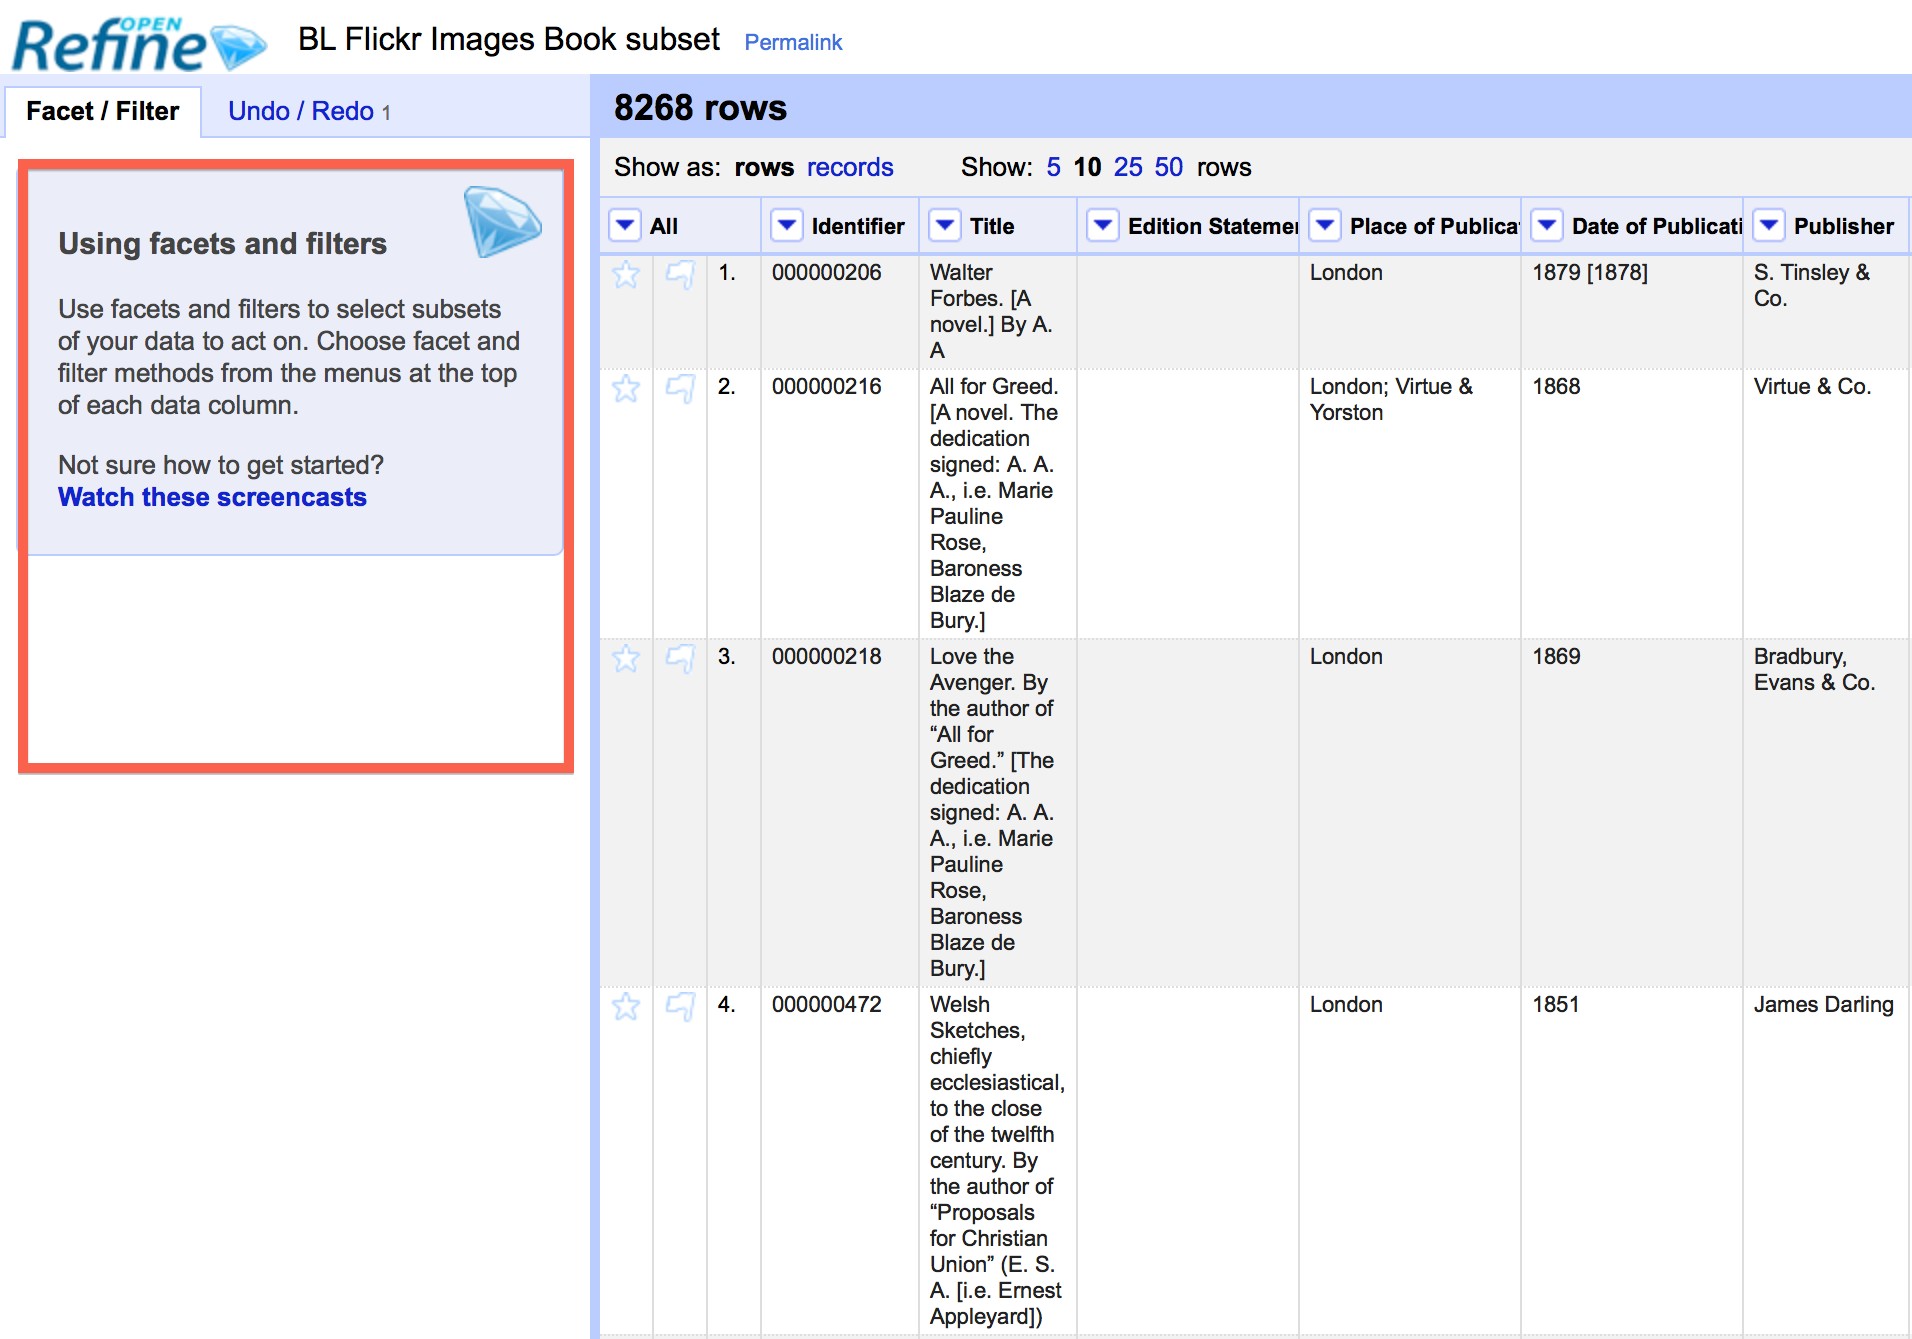
2.2.1. The layout of OpenRefine
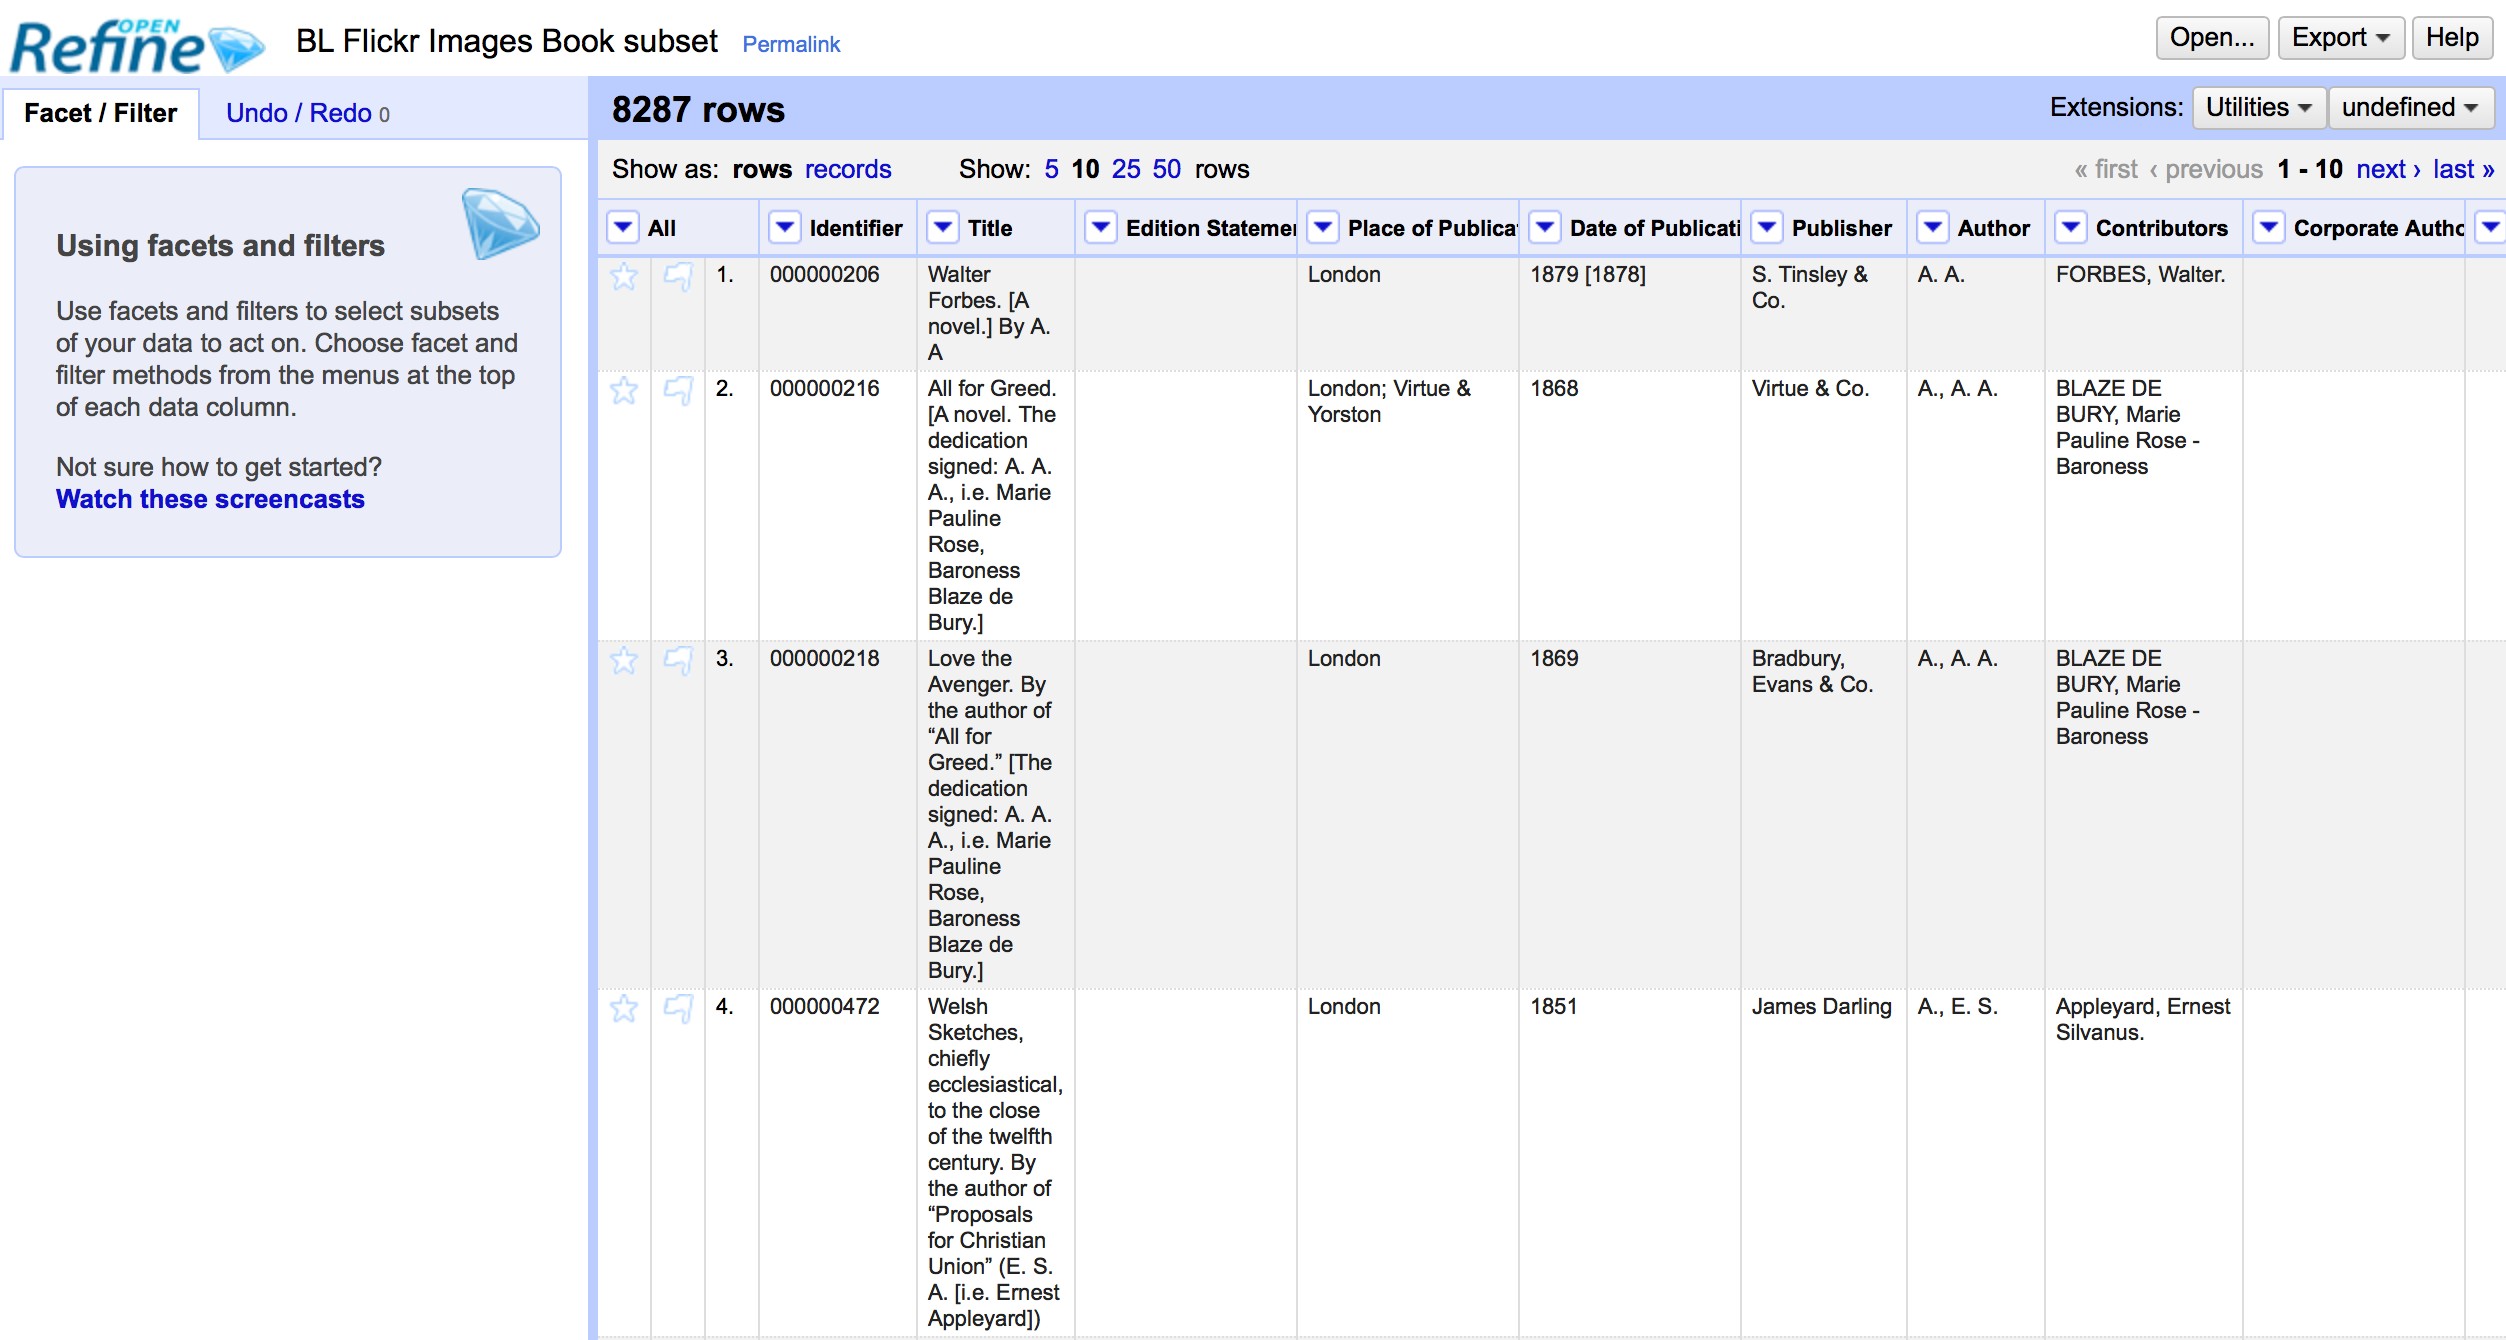
OpenRefine displays data in a tabular format. Each row will usually represent a record in the data, while each column represents a type of information. This is very similar to how you might view data in a spreadsheet or database.
2.2.2. Reordering and renaming columns
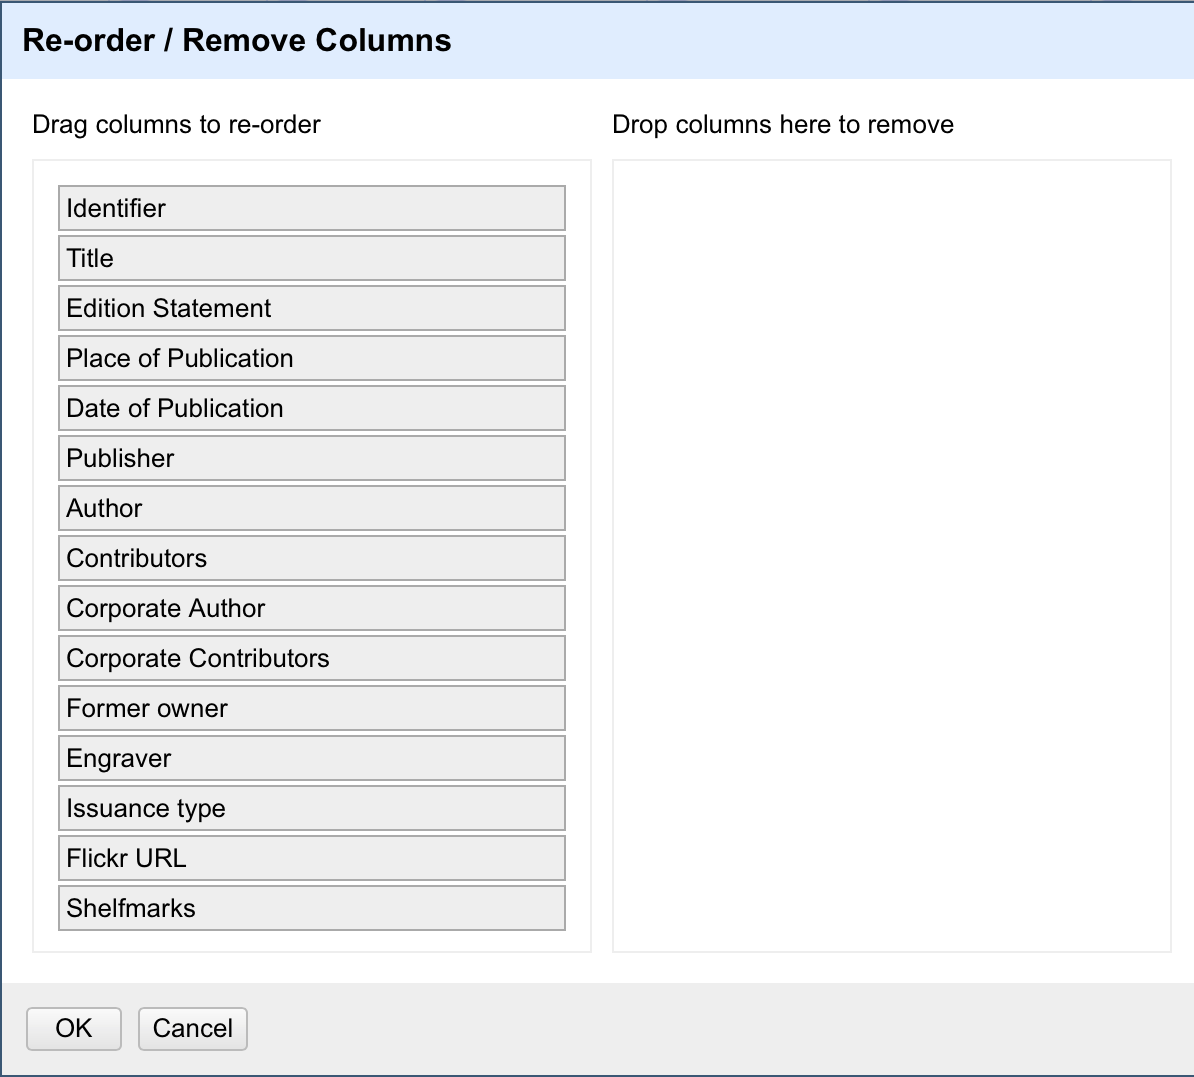
Many operations in OpenRefine are accessed from the drop down menus at the top of each column. You can re-order the columns by clicking the drop down menu at the top of the first column (labelled All), and choosing Edit columns > Re-order / remove columns …
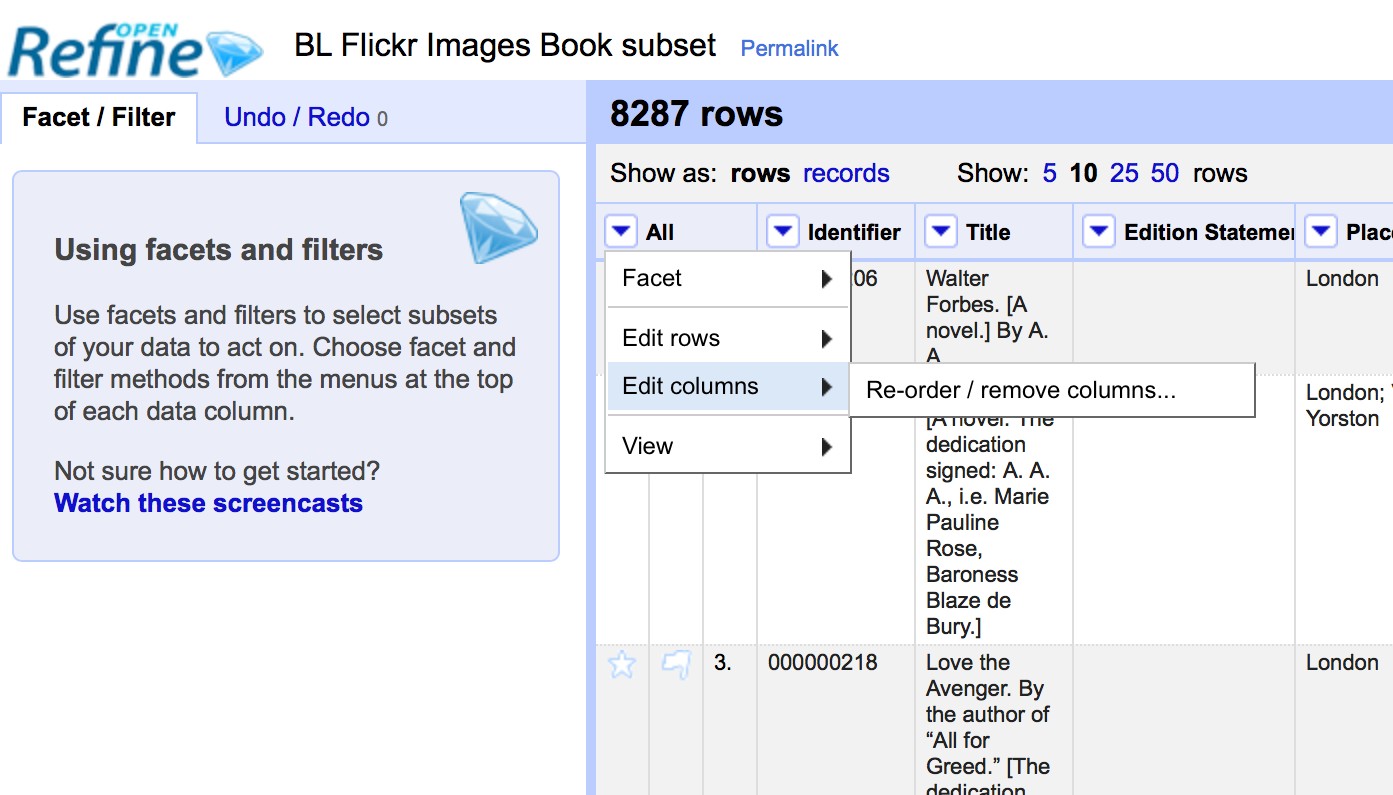
You can then drag and drop column names to re-order the columns, or remove columns completely if they are not required:
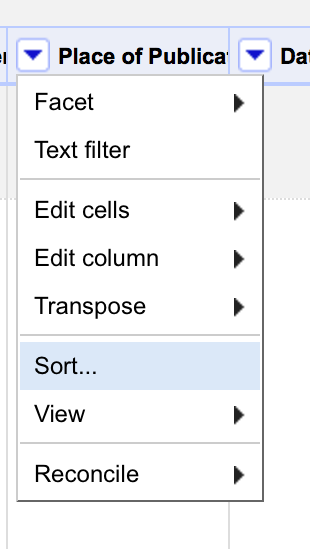
2.2.3. Sorting data
You can sort data in OpenRefine by clicking on the drop down menu for the column you want to sort on, and choosing Sort
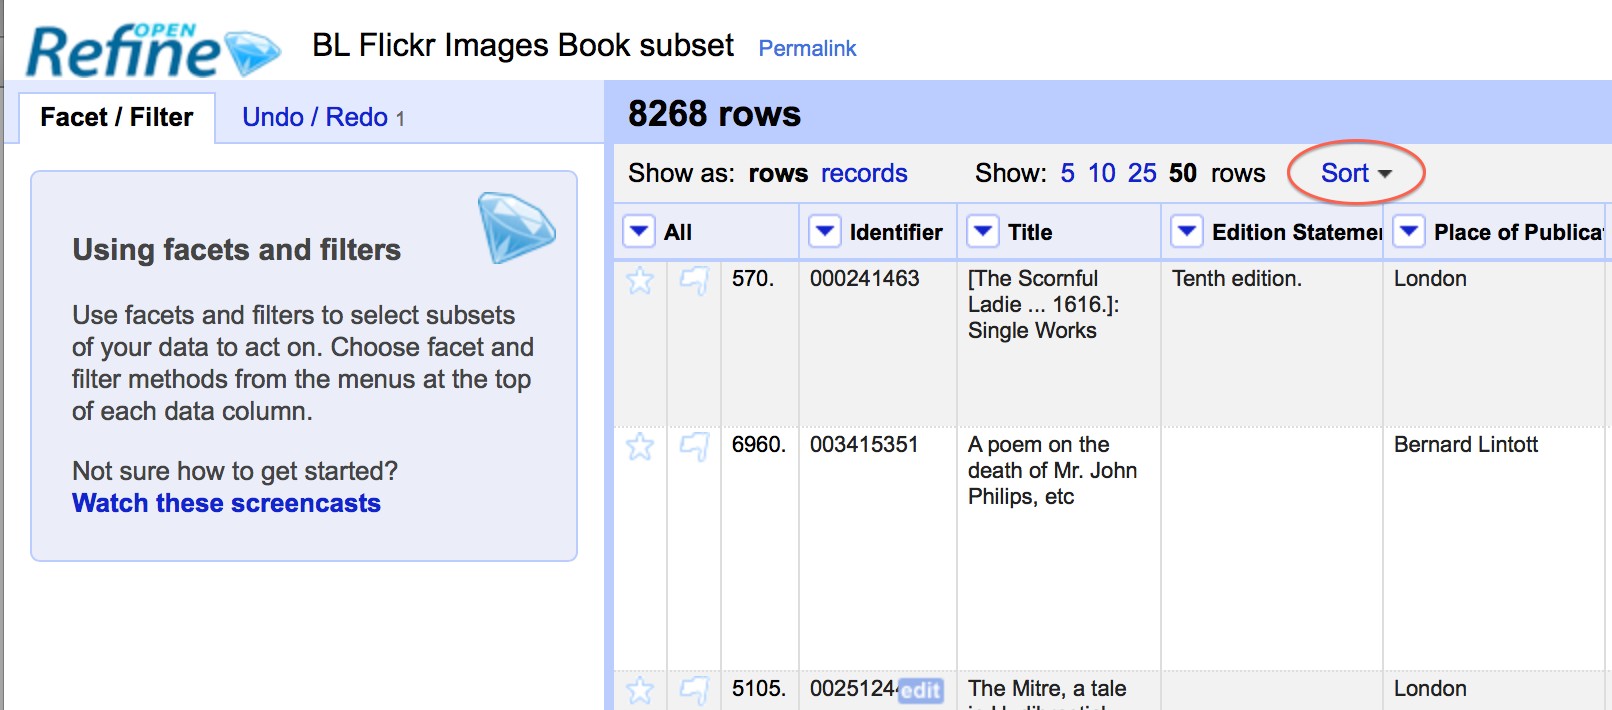
Once you have sorted the data a new Sort drop down menu will be displayed:
Note
Unlike Excel Sorts in OpenRefine are temporary - that is, if you remove the Sort, the data will go back to it*s original unordered state. The Sort drop down menu lets you amend the existing sort (e.g. reverse the sort order), remove existing sorts, and make sorts permanent.
You can sort on multiple columns at the same time.
Exercise 2: Re-order columns and sort data
- Find the Date of Publication column and sort the information by date of publication
- Move the title column to be the second column in the project (after the Identifier column)
2.2.4. Facets
Facets are one of the most useful features of OpenRefine and can help both get an overview of the data in a project as well as helping you bring more consistency to the data.
A Facet groups all the values that appear in a column, and then allow you to filter the data by these values and edit values across many records at the same time.
The simplest type of Facet is called a Text facet. This simply groups all the text values in a column and lists each value with the number of records it appears in. The facet information always appears in the left hand panel in the OpenRefine interface.
To create a Text Facet for a column, click on the drop down menu at the top of the column and choose Facet -> Text Facet. The facet will then appear in the left hand panel.
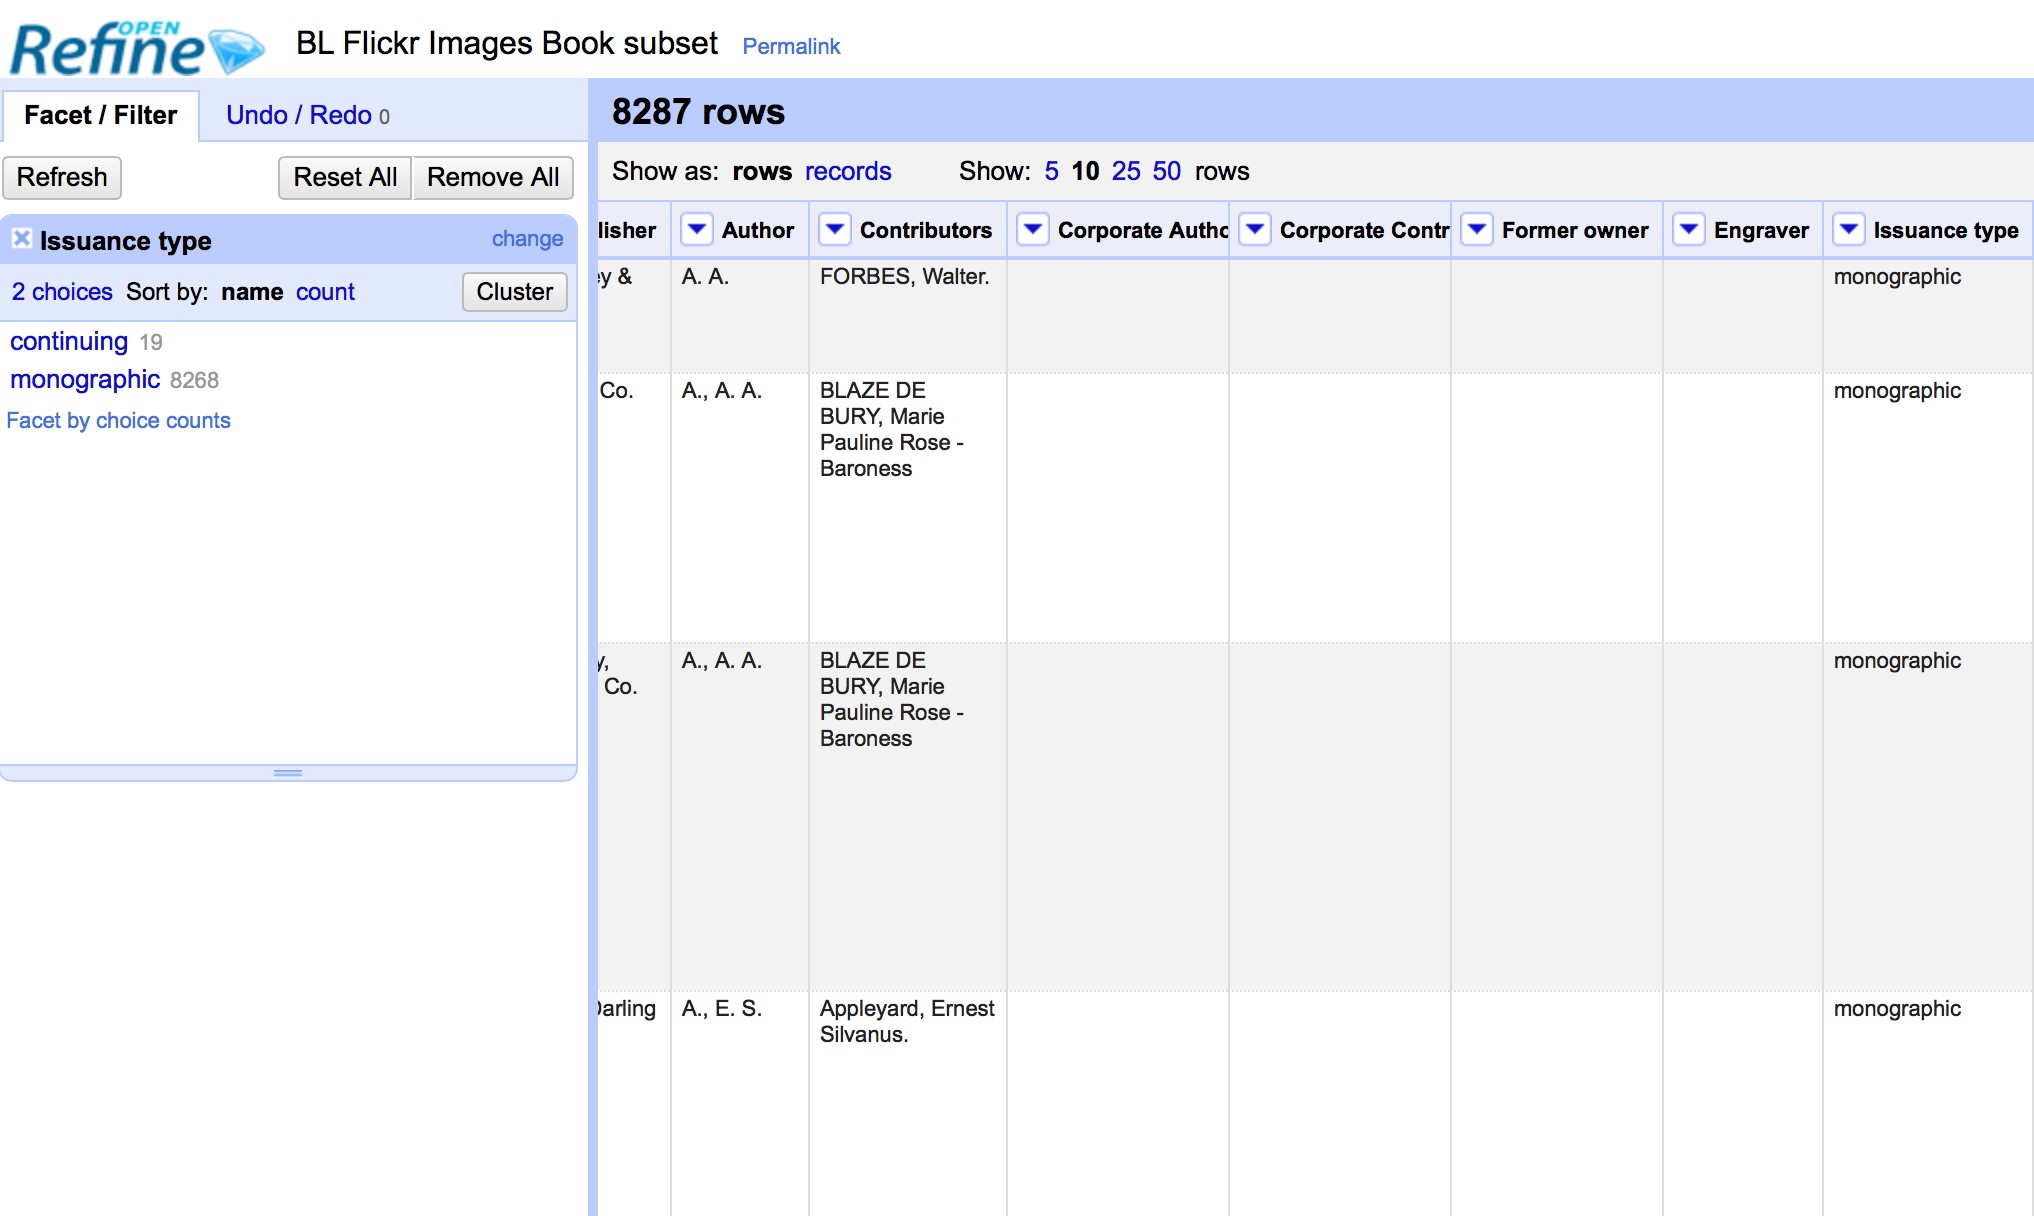
The screenshot below shows a Text Facet on the Issuance Type column. You can see this contains two values continuing and monographic. You can filter the data displayed by clicking on one of these headings.
You can include multiple values from the facet in a filter at one time by using the Include option which appears when you put your mouse over a value in the Facet.
You can also invert the filter to show all records which do not match your selected values. This option appears at the top of the Facet panel when you select a value from the facet to apply as a filter.
2.2.5. Filters
As well as using Facets to filter the data displayed in OpenRefine you can also apply Text Filters which looks for a particular piece of text appearing in a column. Text filters are applied by clicking the drop down menu at the top of the column you want to apply the filter to and choosing Text filter.
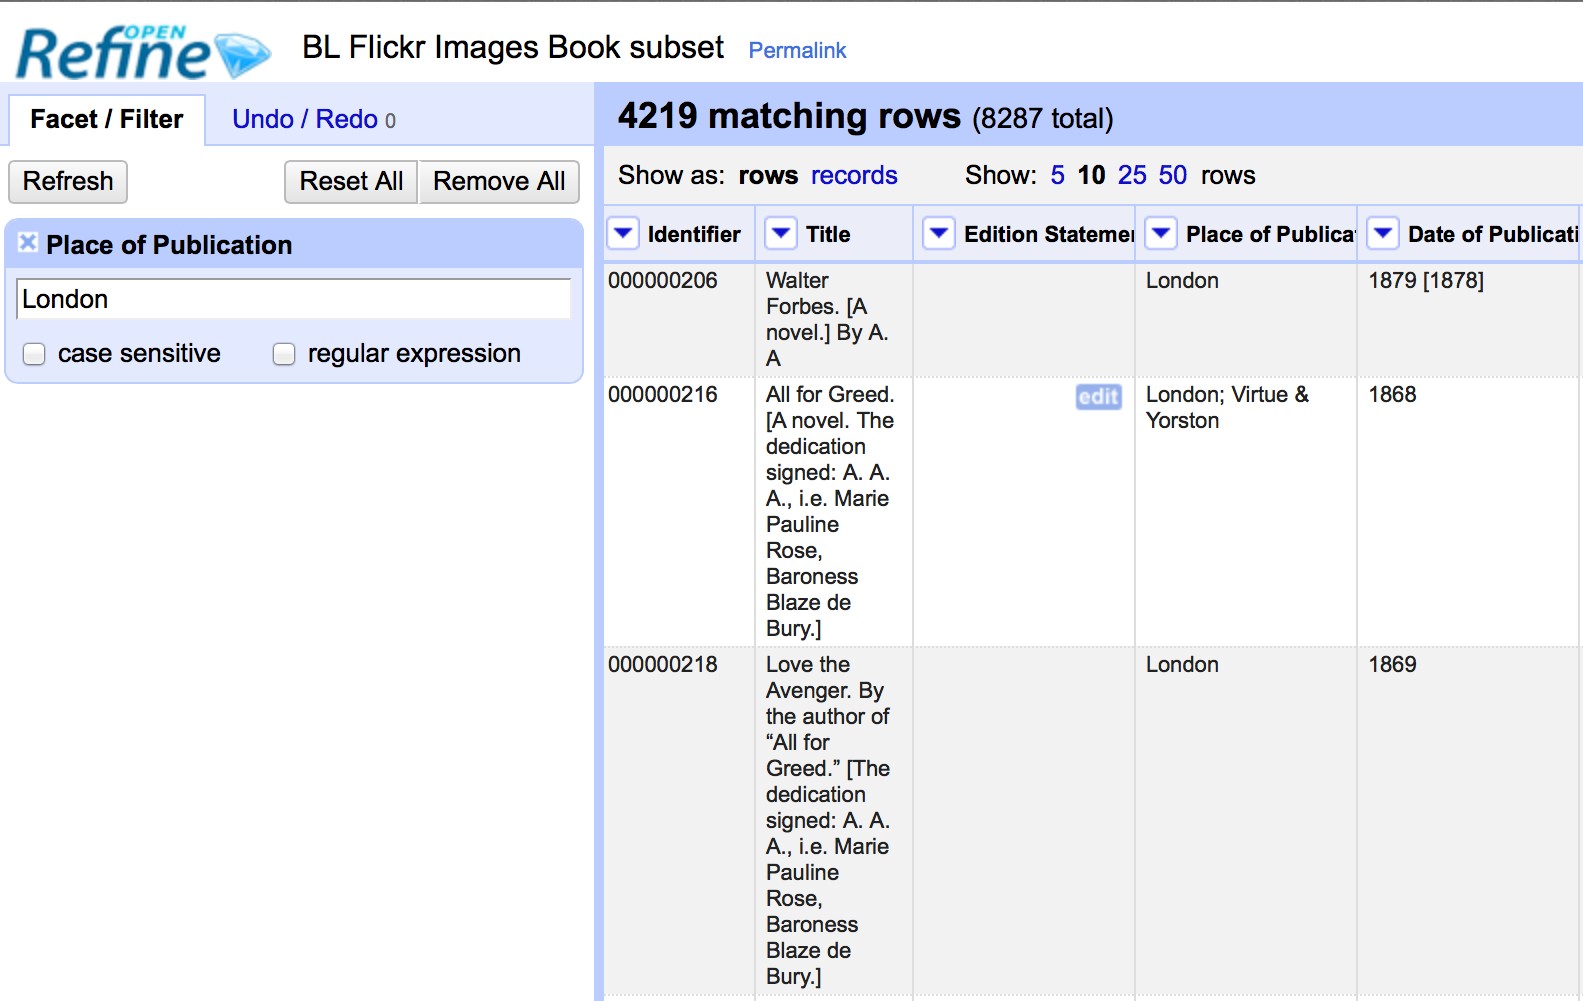
As with Facets, the Filter options appear in the left hand panel in OpenRefine. Simply type in the text you want to use in the Filter to display only rows which contain that text in the relevant column.
2.2.6. Working with filtered data
It is very important to note that when you have filtered the data displayed in OpenRefine, any operations you carry out will apply only to the rows that match the filter - that is the data currently being displayed.
In particular if you wish to remove rows that match a filter, you can do this as follows:
- Filter the data using Facets or Filters
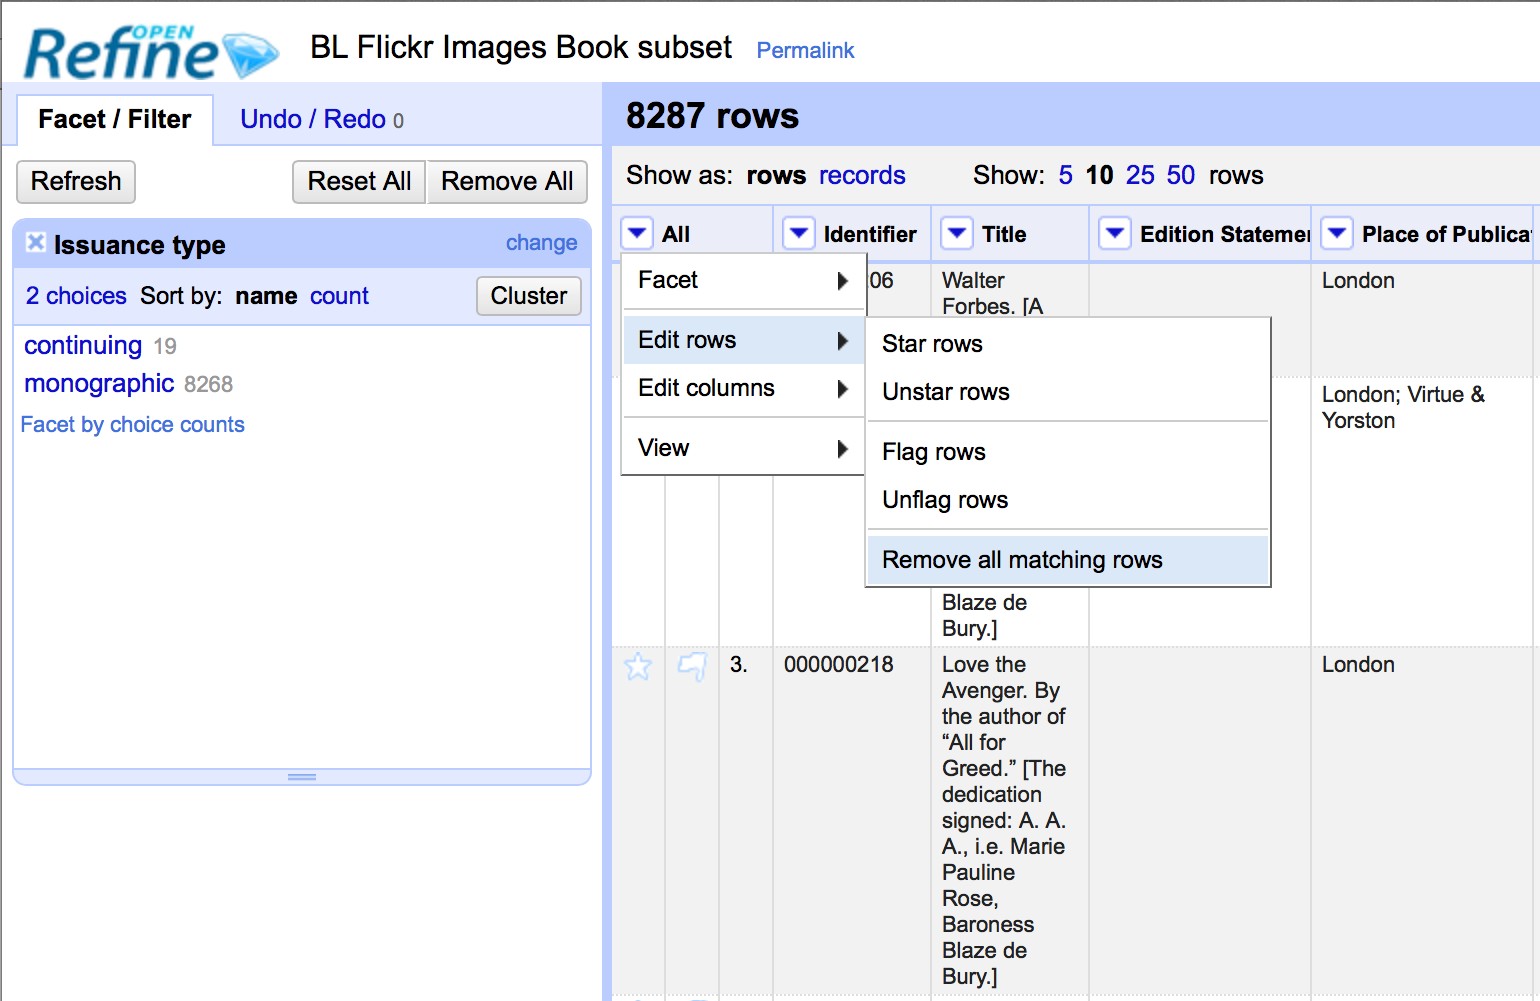
- Clicking on the drop down menu under the All column heading (this is always the first column in an OpenRefine project)
- Choose Edit rows > Remove all matching rows
This will remove all rows that were displayed by the filter:
Exercise 3: Remove all continuing publications from this data set
- Create a facet for the Issuance Type column
- Filter the data to only show those rows which represent continuing publications
- Remove these rows from the data set
2.2.7. More on Facets
As well as Text facets Refine also supports a range of other types of facet. These include:
- Numeric facets
- Timeline facets (for dates)
- Custom facets
- Scatterplot facets
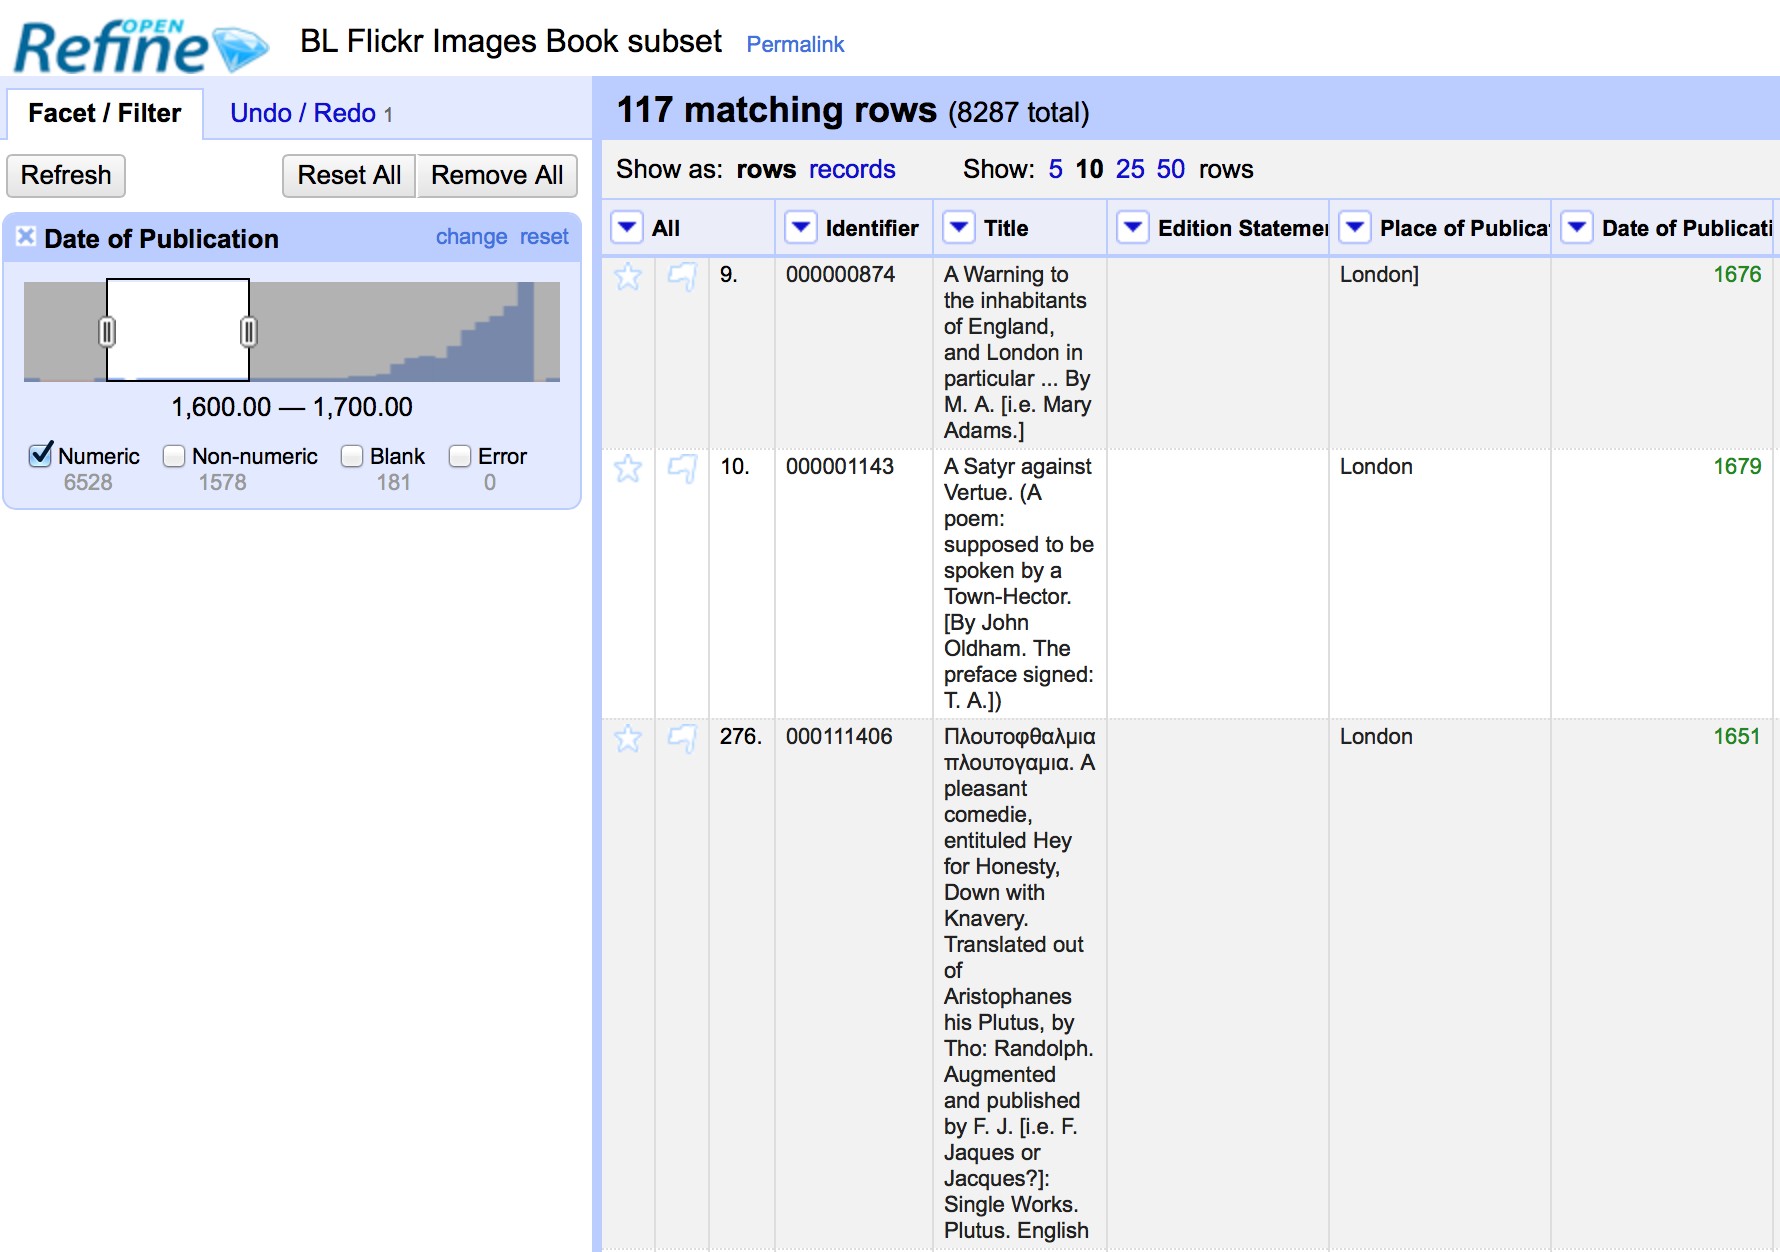
Numeric and Timeline facets display graphs instead of lists of values. The graph includes drag and drop controls you can use to set a start and end range to filter the data displayed.
Scatterplot facets are commonly used in statistics. One example can be found in the following OpenRefine Tutorial
Custom facets are a range of different types of facets, and also allow you write your own custom facets. Some of the default custom facets are:
- Word facet - this breaks down text into words and counts the number of records each word appears in
- Duplicates facet - this results in a binary facet of true or false. Rows appear in the true facet if the value in the selected column is an exact match for a value in the same column in another row
- Text length facet - creates a numeric facet based on the length (number of characters) of the text in each row for the selected column. This can be useful for spotting incorrect or unusual data in a field where specific lengths are expected (e.g. if the values are expected to be years, any row with a text length more than 4 for that column is likely to be incorrect)
- Facet by blank - a binary facet of true or false. Rows appear in the true facet if they have no data present in that column. This is useful when looking for rows missing key data.
Facets are intended to group together common values and OpenRefine limits the number of values allowed in a single facet to ensure the software does not perform slowly or run out of memory. If you create a facet where there are many unique values (for example, a facet on a book title column in a data set that has one row per book) the facet created will be very large and may either slow down the application, or OpenRefine will not create the facet.
Exercise 4: Find all publications without a date of publication
- Use the Facet by blank function to find all publications in this data set without a date of publication
- Filter the data to only those without a date of publication - do you notice anything about these records? [Hint: look at the Place of Publication column]
2.2.8. Amending data through facets
If you create a text facet you can edit the values in the facet to change the value for several records at the same time. To do this, simply mouse-over the value you want to edit and click the edit option that appears:
This approach is useful in relatively small facets where you might have small variations through punctuation or typing errors etc. For example, a column that should contain only terms from a small restricted list such as days of the week or months of the year.
The list of values in the facet will update as you make edits.
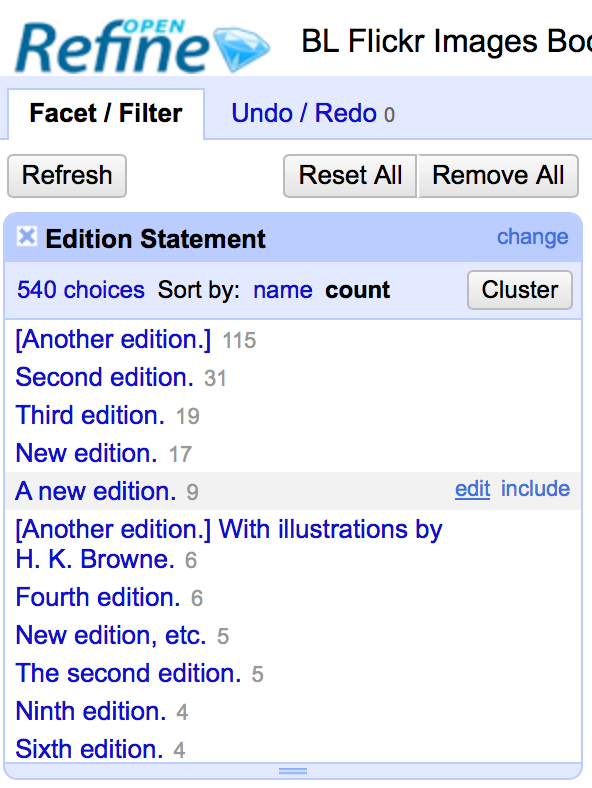
Exercise 5: Edit edition statements via a text facet
- Create a text facet for the Edition column
- Sort the facet by count to see the most common values
- Pick the facets that refer to a second edition and edit them using a consistent wording
2.2.9. Using Clustering to find similar values
Another function that is provided with facets is the Cluster function. The Cluster function looks for similar values across the facet and enables you to merge together several facets to a single value.
This is very effective where you have data where there can be minor variations in data values that are likely such as names of people, organisations and places.
To use the the Cluster function, create a Facet on the relevant column and click the Cluster button. This will bring up a new window where you can see the Clusters that have been detected and work with them:
The Clusters are created automatically according to an algorithm. There are a number of different algorithms supported by OpenRefine - some experimentation maybe required to see which clustering algorithm works best with any particular set of data, and you may find that using different algorithms highlights different clusters.
For more information on the methods used to create Clusters see the OpenRefine wiki
For each cluster you have the option of merging the values together - that is replace with a single consistent value. By default OpenRefine uses the most common value in the cluster as the new value, but you can select one of the other values by clicking the value itself, or you can simply type the desired value into the New Cell Value box.
The Clustering function can also be accessed via the drop down menu at the top of a column by selecting Edit cells > Cluster and edit …
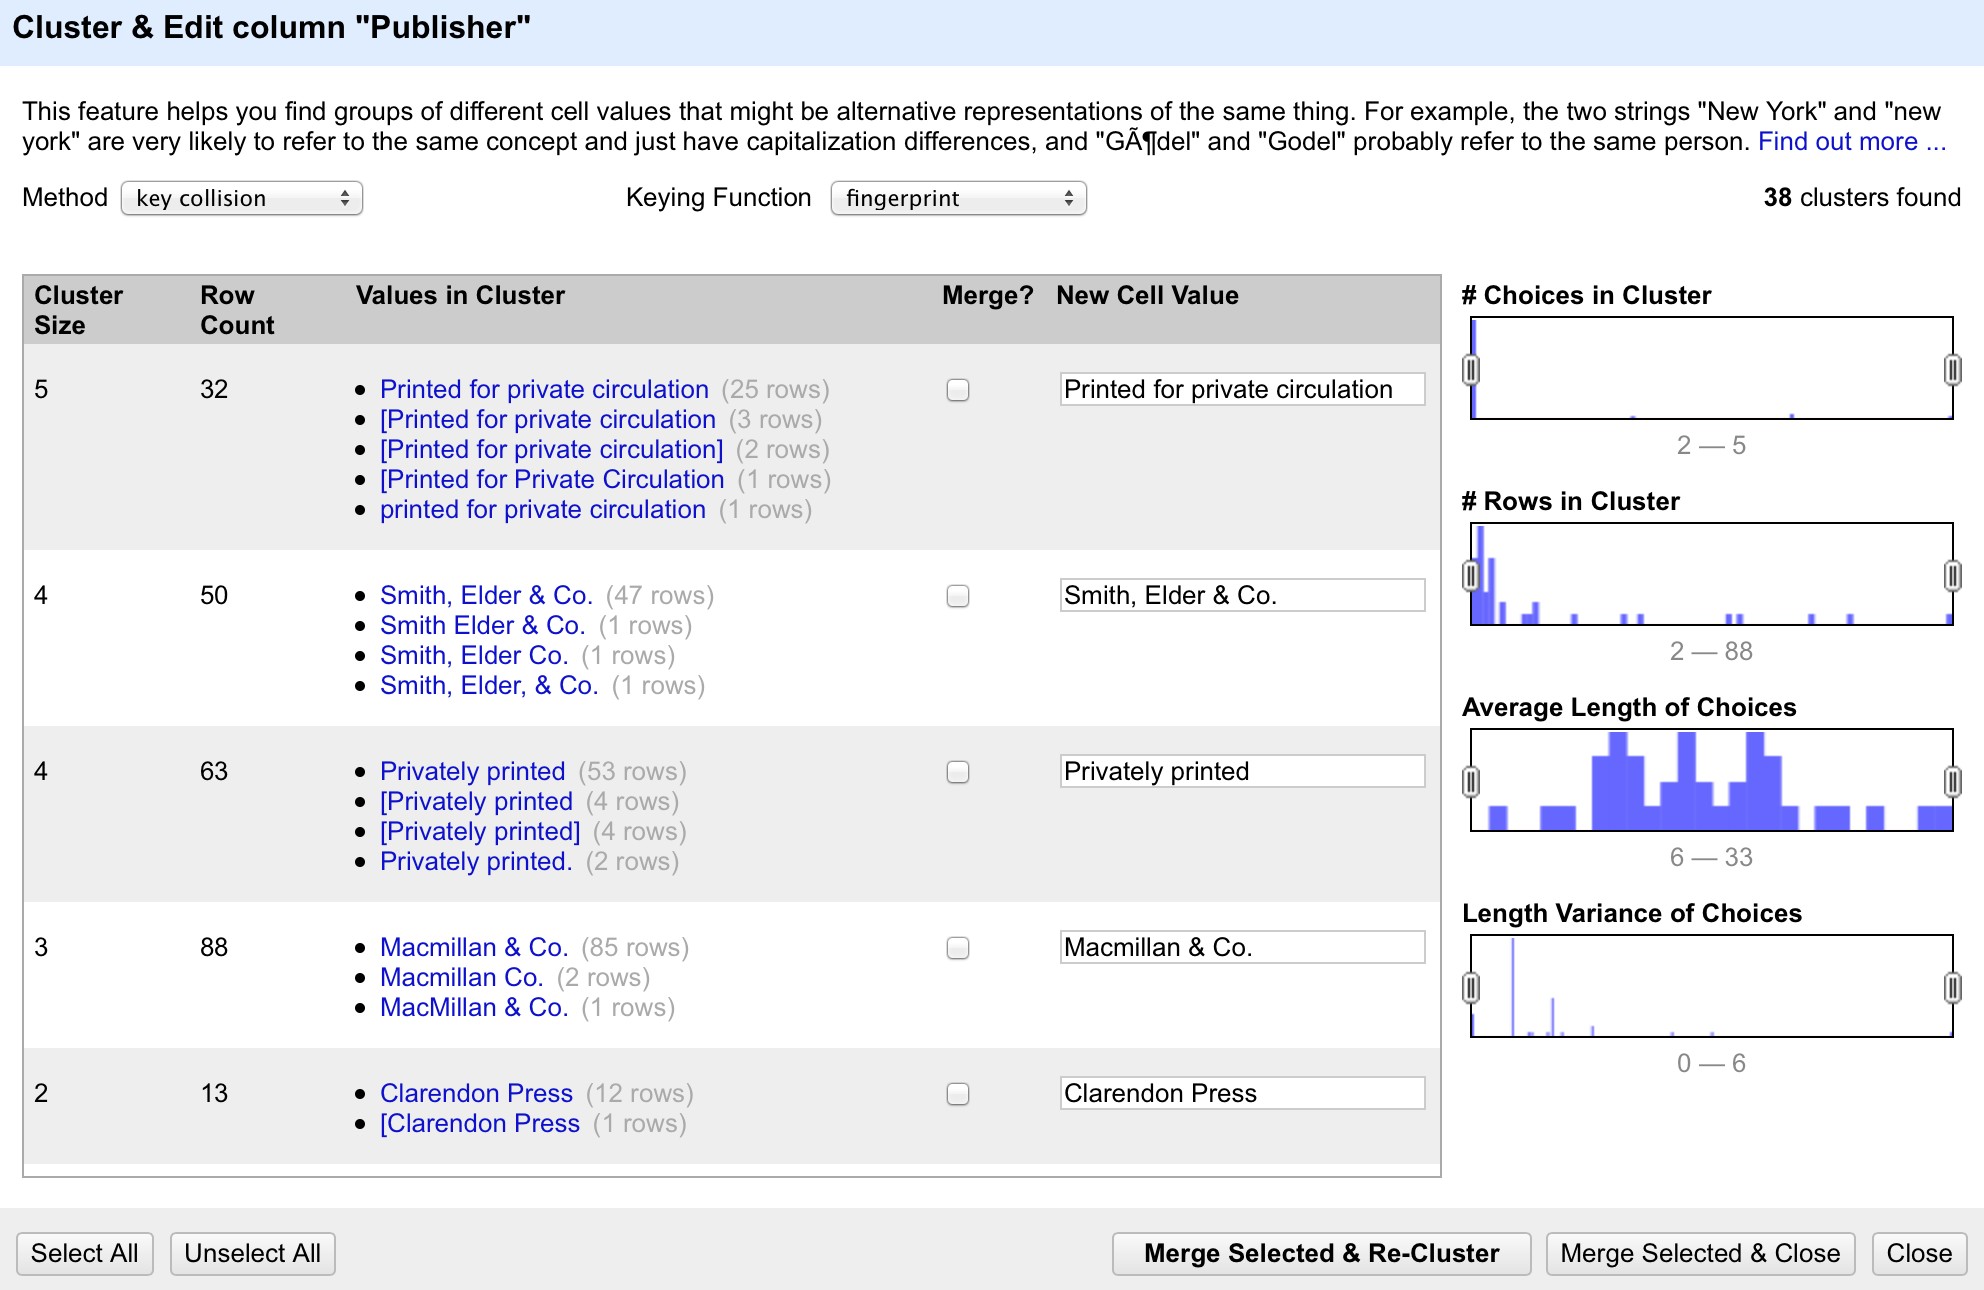
Exercise 6: Use Clustering to clean up publisher data
- Create a Text Facet for the Publisher column
- Click Cluster
- Using the key collision method with the fingerprint Keying Function work through the clusters of values, merging them to a single value where appropriate
2.3. Introducing Transformations
Through facets, filters and clusters OpenRefine offers relatively straightforward ways of getting an overview of your data, and making changes where you want to standardise terms used to a common set of values.
However, sometimes there will be changes you want to make to the data that cannot be achieved in this way. Such types of changes include:
- Splitting data that is in a single column into multiple columns (e.g. splitting an address into multiple parts)
- Standardising the format of data in a column without changing the values (e.g. removing punctuation or standardising a date format)
- Extracting a particular type of data from a longer text string (e.g. finding ISBNs in a bibliographic citation)
To support this type of activity OpenRefine supports Transformations which are ways of manipulating data in columns. Transformations are normally written in a special language called GREL (Google Refine Expression Language). To some extent GREL expressions are similar to Excel Forumla, although they tend to focus on text manipulations rather than numeric functions.
Full documentation for the GREL is available at Google-refine-expression-language. This tutorial covers only a small subset of the commands available.
To start writing transformations, select the column on which you wish to perform a transformation and choose Edit cells > Transform… to see the following screen:
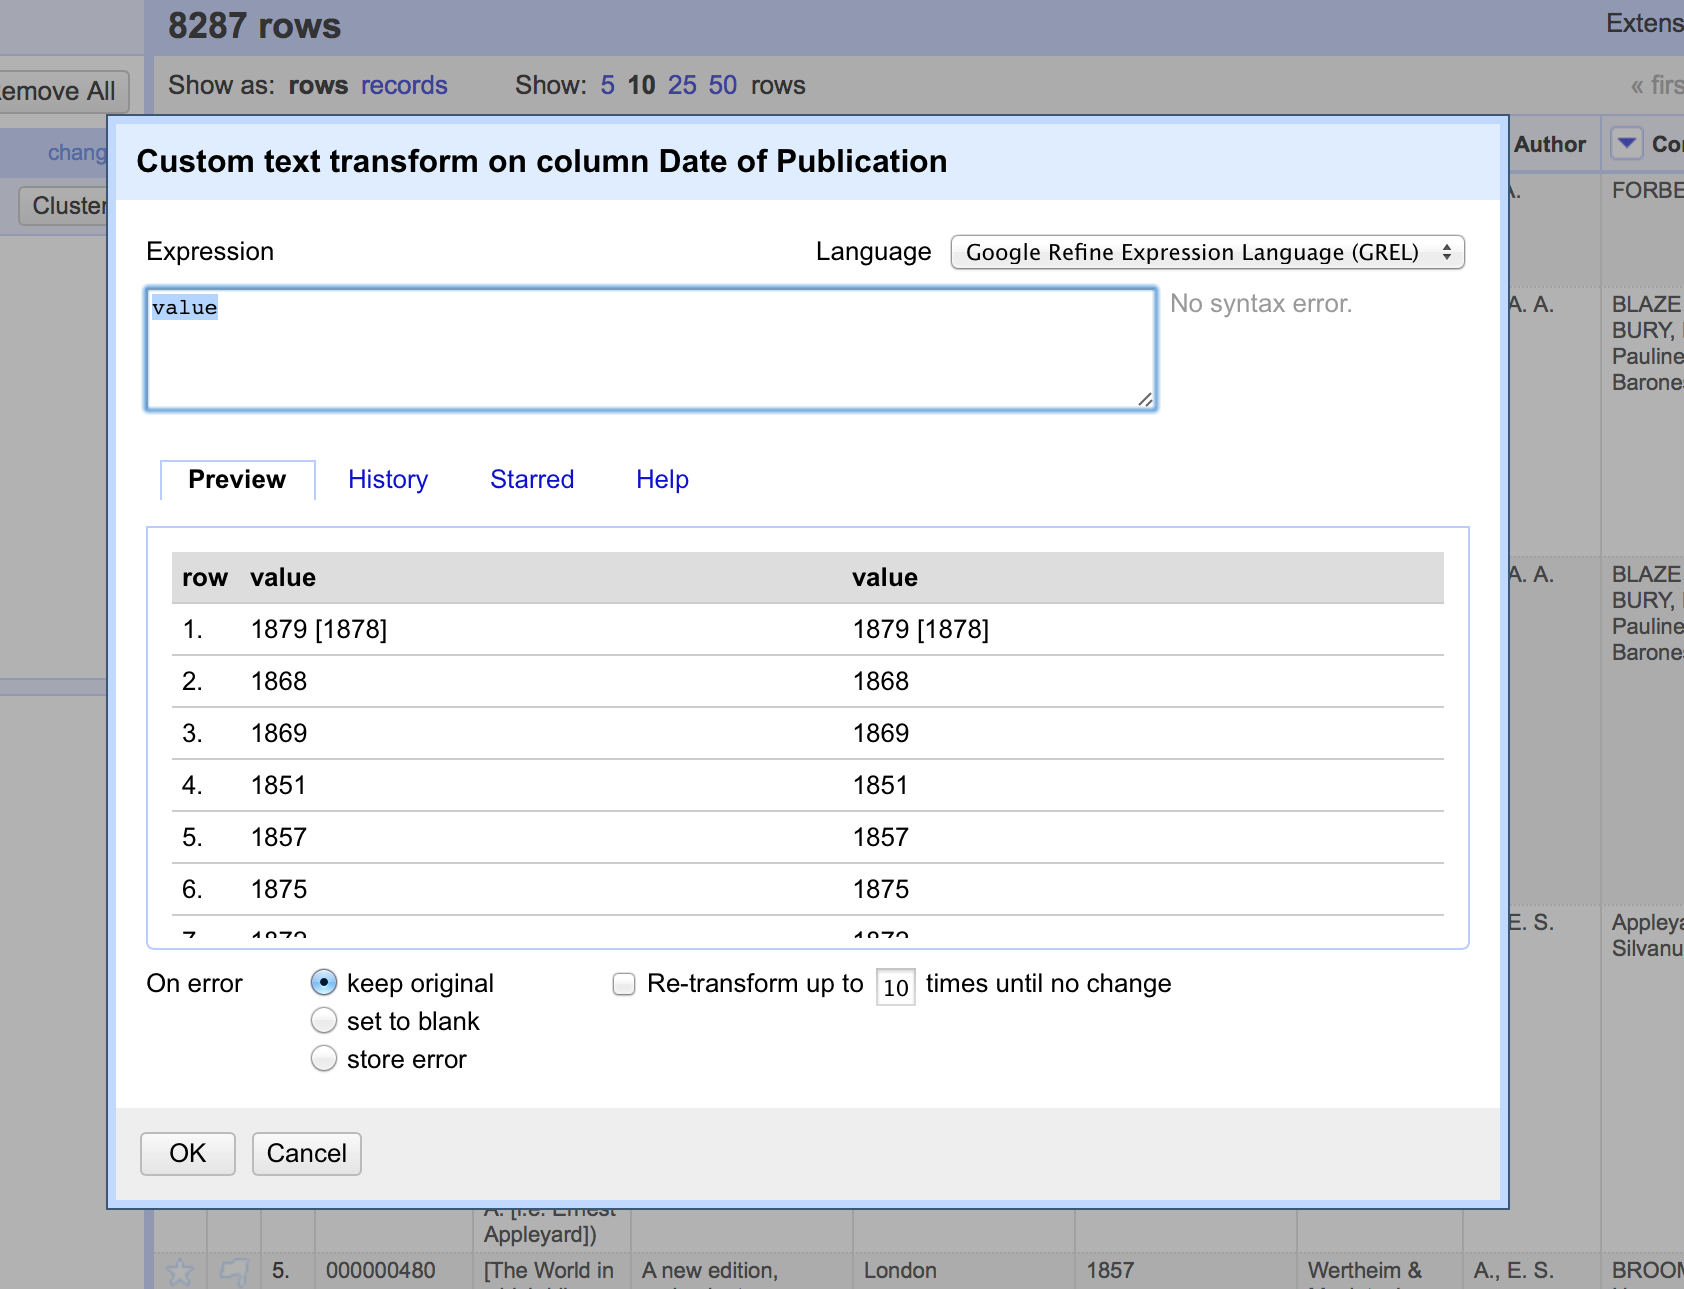
In this screen you have a place to write a transformation (the Expression box) and then the ability to Preview the effect the transformation would have on the first 10 rows of your data.
The transformation you type into the Expression box has to be a valid GREL expression. The simplest expression is simply the word value by itself - which simply means the value that is currently in the column - that is, make no change.
GREL functions are written by giving a value of some kind (a text
string, a date, a number etc.) to a GREL function. Some GREL
functions take additional parameters or options which control how
the function works. GREL supports two syntaxes:
value.function(options) or function(value, options)
Either is valid, and which is used is completely down to personal preference. Next to the Preview option are options to view:
- History - a list of transformations you*ve previously used with the option to reuse them immediately or to star them for easy access
- Starred - a list of transformations you*ve starred via the History view
- Help - a list of all the GREL functions and brief information on how to use them
2.3.1. Some simple transformations
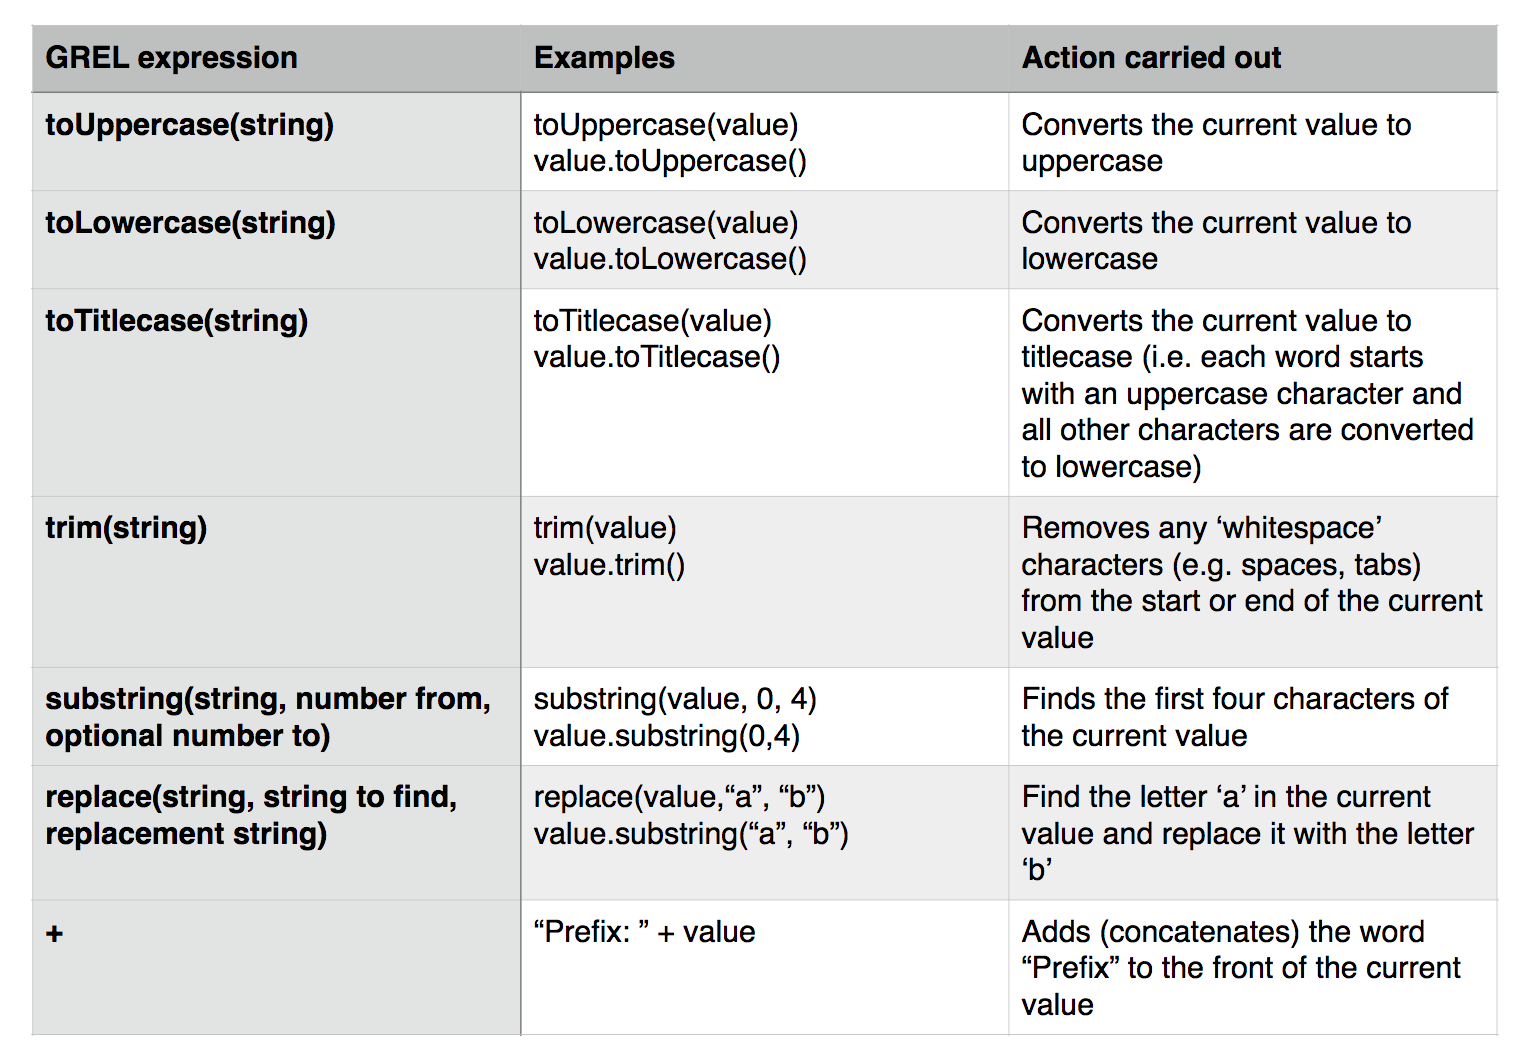
Exercise 7: Cleaning up Date of Publication using simple transformations
- Create a facet based on the Date of Publication column
- Sort the facet by name
- What are common issues with the values in this list?
- Use the replace GREL expression to remove the characters [, ] and ? from the Date of Publication column
- What other issues can you see with the data of publication column?
- What approaches might you use to overcome these issues?
- Do you think it is possible to achieve a single coumn with a four digit data in it to represent data of publication?
2.3.2. Undo and Redo
OpenRefine lets you undo, and redo, any number of steps you have taken in cleaning the data. This means you can always try out transformations and undo if you need to. The way OpenRefine records the steps you have taken even allows you to take the steps you*ve carried out on one data set, and apply it to another data set by a simple copy and paste operation.
The Undo and Redo options are accessed via the lefthand panel.
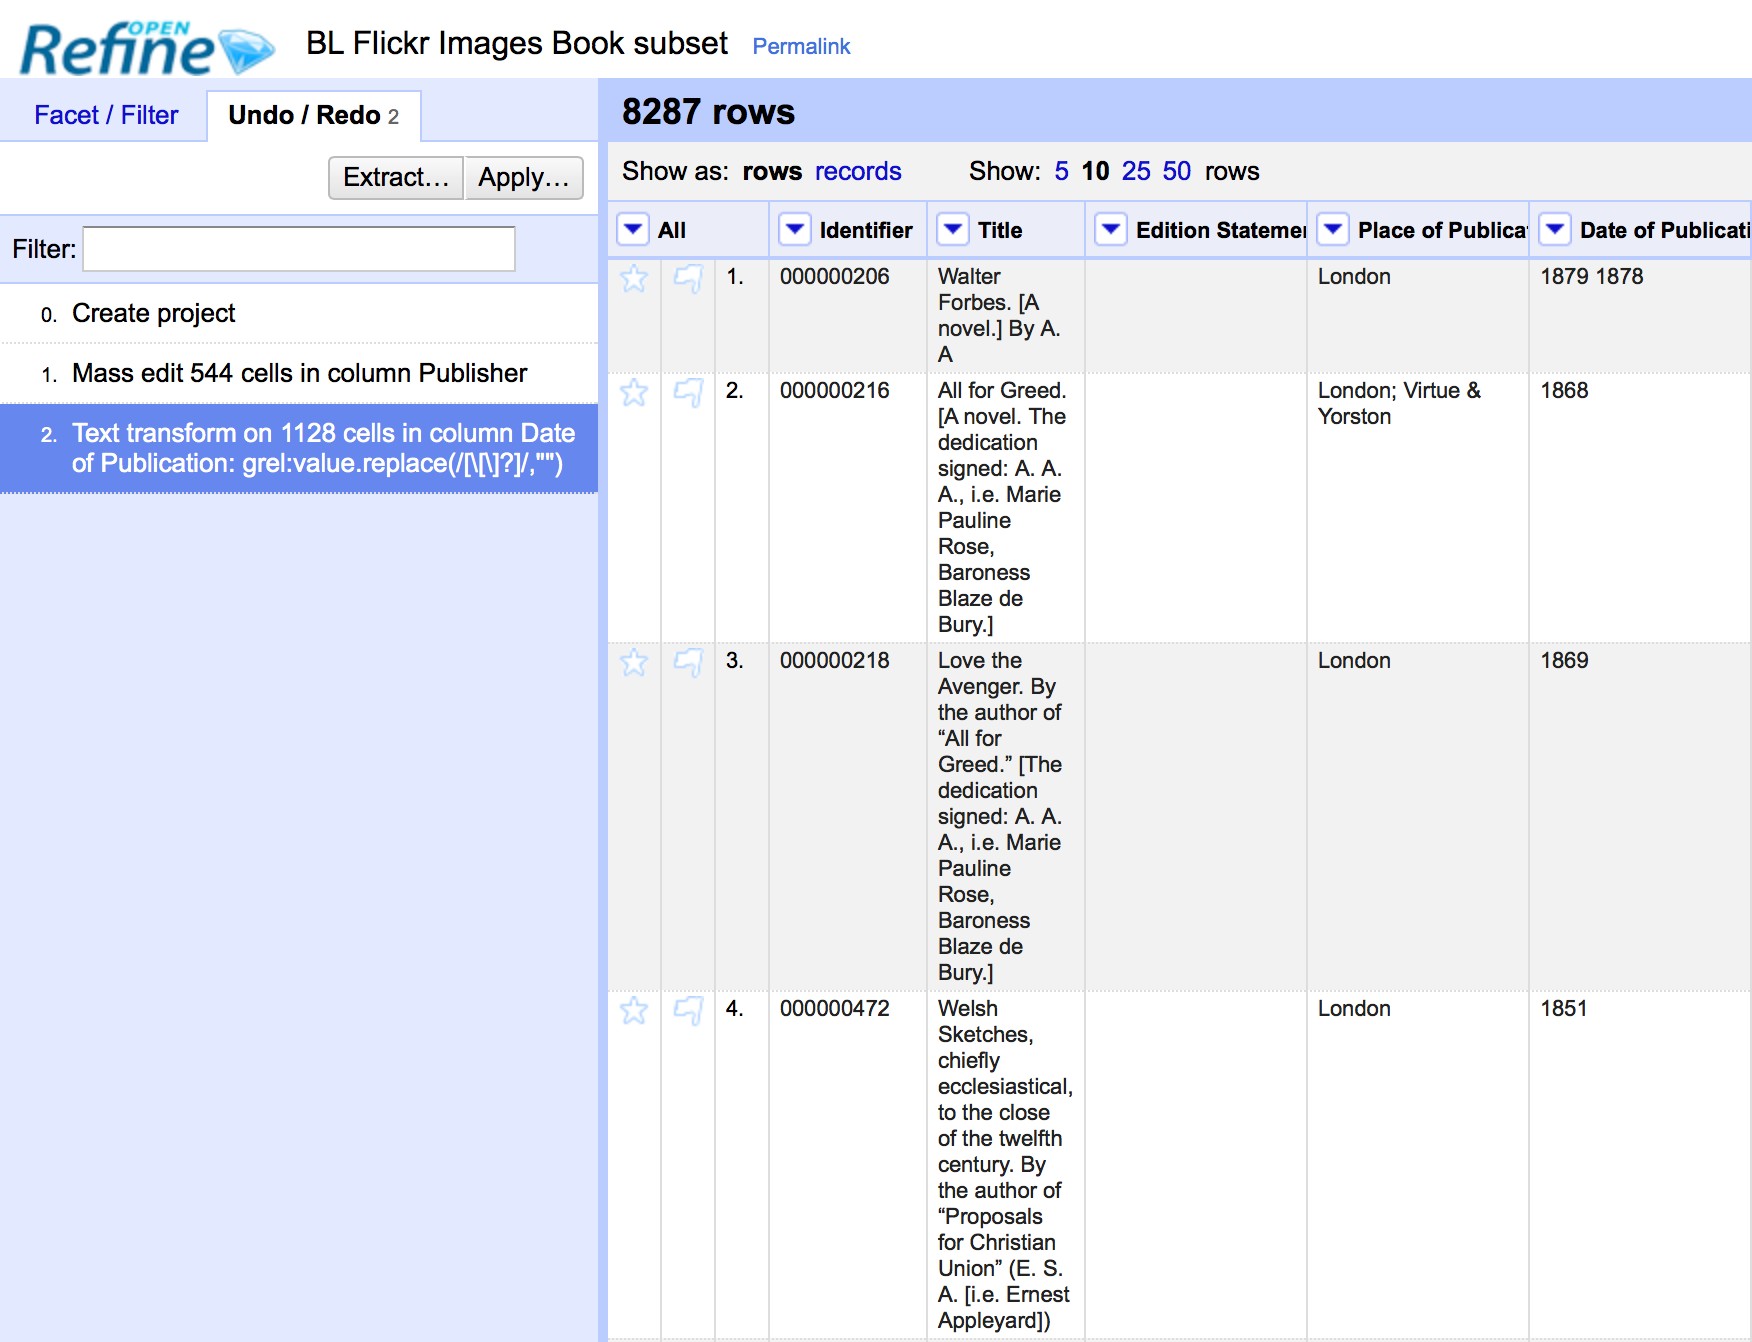
The Undo/Redo panel lists all the steps you*ve taken so far. To undo steps, simply click on the last step you want to preserve in the list and this will automatically undo all the changes made since that step.
The remaining steps will continue to show in the list but greyed out, and you can reapply them by simply clicking on the last step you want to apply.
However, if you undo a set of steps and then start doing new transformations, the greyed out steps will disappear and you will no longer have the option to redo these steps.
If you wish to save a set of steps to be re-applied later, or to a different project, you can click the Extract button. This gives you the option to select the steps you want to save, and to copy the transformations included in the selected steps in a format called JSON
To apply a set of steps you have copied or saved in this JSON format use the Apply button and paste in the JSON. In this way you can share transformations between projects and each other.
Undo/Redo data is stored with the Project and is saved automatically as you work, so next time you open the project, you can access your full history of steps you have carried out and undo/redo in exactly the same way.
2.3.3. Exporting data
Once you have finished working with a data set in OpenRefine you may wish to export it. The export options are accessed through the Export button at the top right of the OpenRefine interface
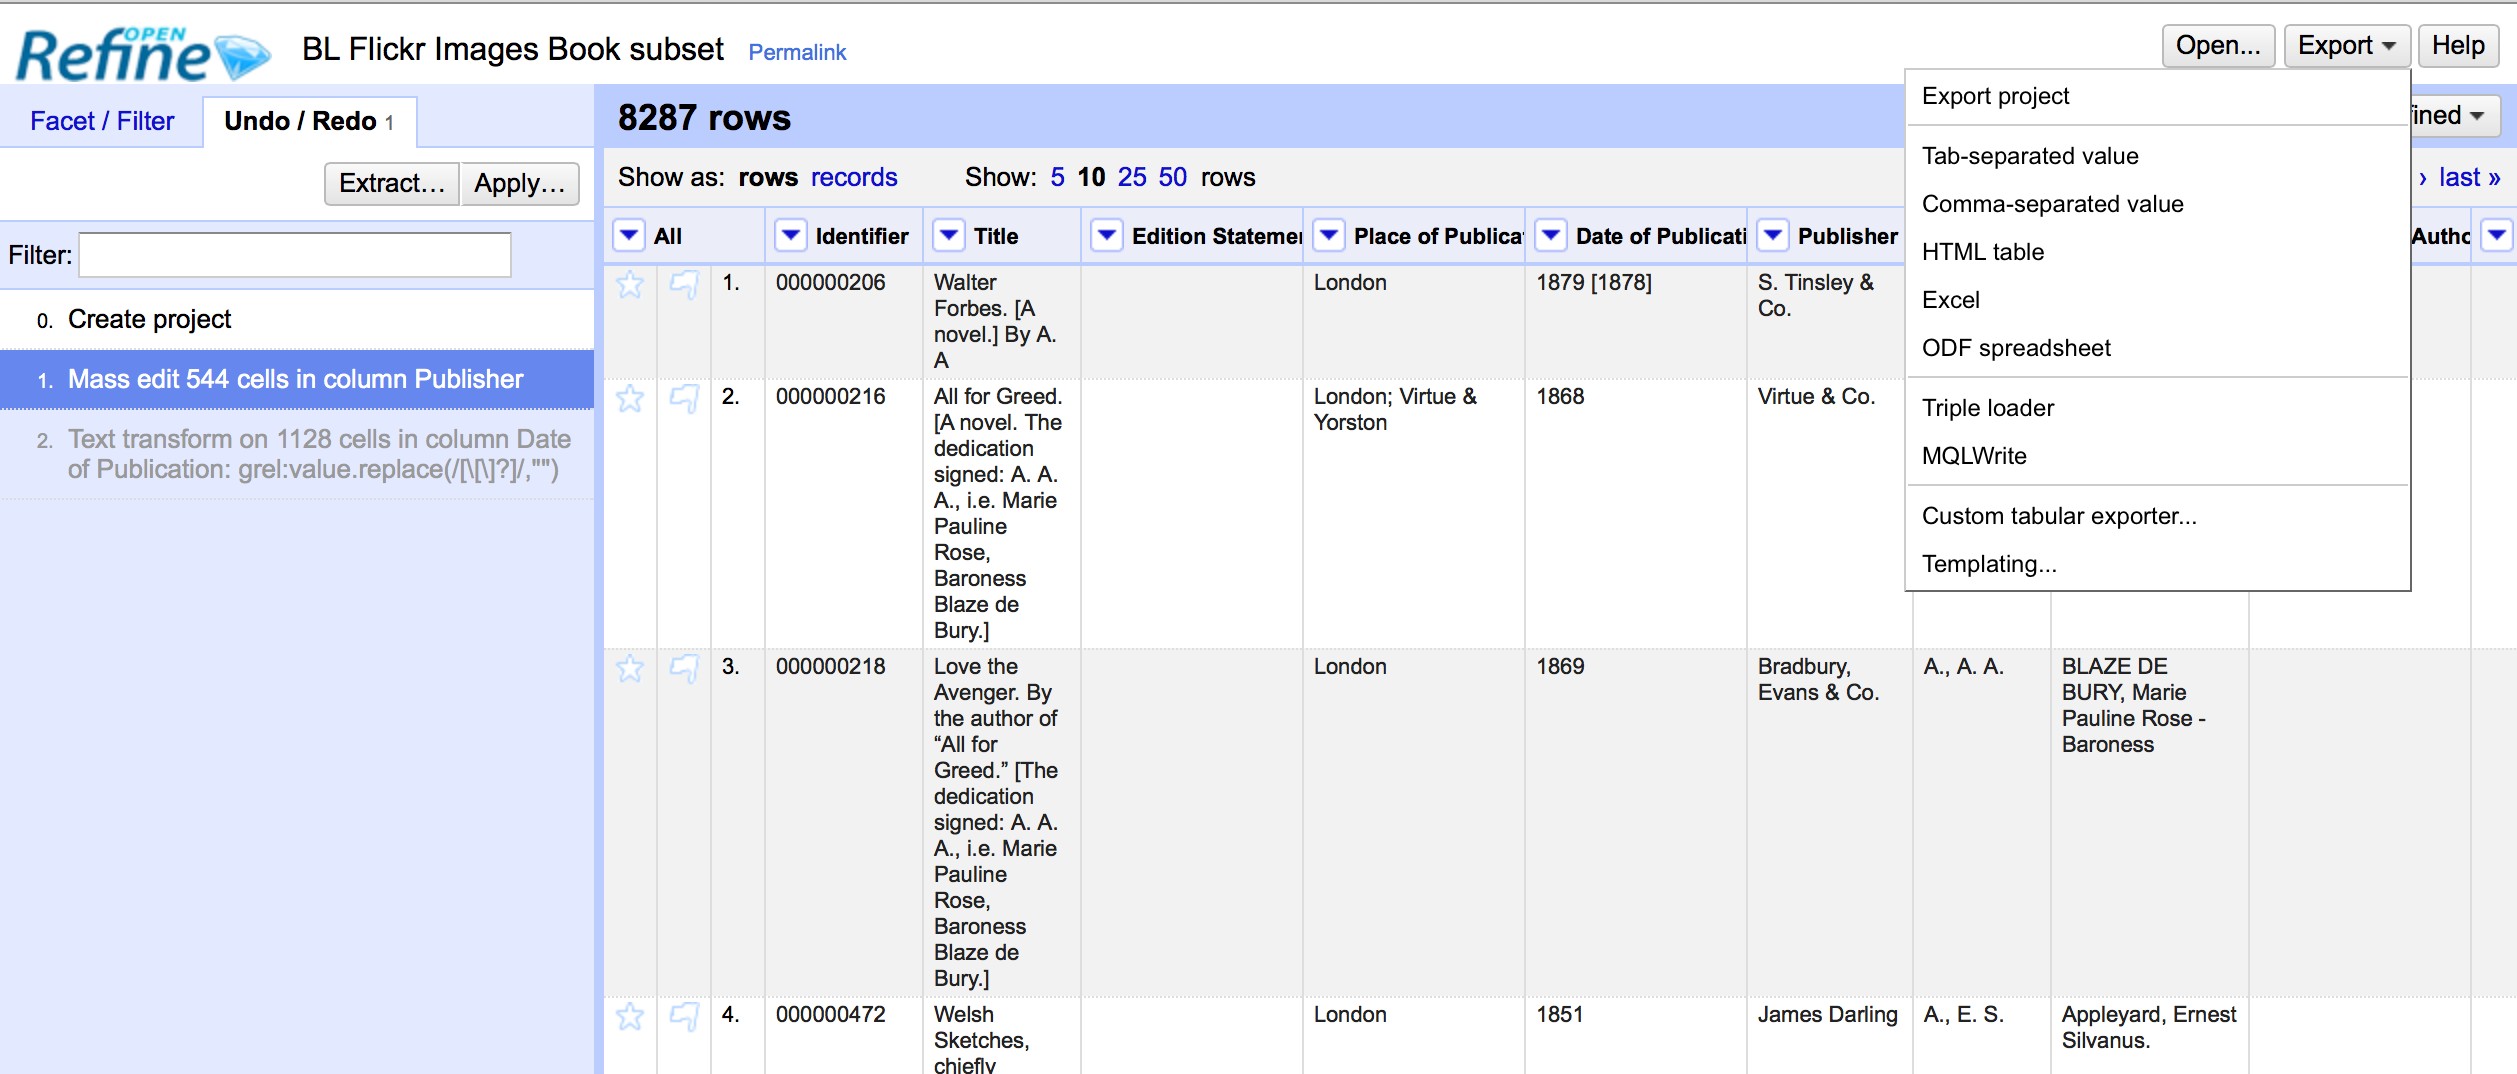
Export formats support include HTML, Excel and comma- and tab-separated value (csv and tsv). You can also write a custom export, selecting to export specific fields, adding a header or footer and specifying the exact format.
2.3.4. Data types and Regular Expressions
Understanding data types and regular expressions will help you write more complex transformations using GREL.
2.3.5. Data types in OpenRefine
Every piece of data in OpenRefine is has a type. The most common type is a string - that is a piece of text. However there are other data types available and transformations let you convert data from one type to another where appropriate. The data types supported are:
- String
- Number
- Date
- Boolean
- Array
The first three are hopefully self-explanatory, but the latter two may require slightly more explanation.
A Boolean is a binary value that can either be true or
false. Boolean values can be used directly in OpenRefine cell, but
is more often used in transformations as part of a GREL expression.
For example: value.contains("test")
Generates a boolean value of either true or false depending on whether the current value in the cell contains the text test anywhere. Such tests can be combined with other GREL expressions to create more complex transformations.
An Array is a list of values, represented in Refine by the use
of square brackets containing a list of values surrounded by
inverted commas and separated by commas. For example an array
listing the days of the week would look like:
["Monday","Tuesday","Wednesday","Thursday","Friday","Saturday","Sunday"]
Arrays can be sorted, de-duplicated, and manipulated in other ways in GREL expressions, but cannot appear directly in an OpenRefine cell. Arrays in OpenRefine are usually the result of a transformation. For example the split function takes a string, and changes it into an array based on a separator. For example if a cell has the value:
"Monday,Tuesday,Wednesday,Thursday,Friday,Saturday,Sunday"
This can be transformed into an array using the split function:
value.split(",")
This would create the array containing the days of the week:
["Monday","Tuesday","Wednesday","Thursday","Friday","Saturday","Sunday"]
This can be combined with array operations like sort. For example, assuming the cell contains the same value as above, then the function:
value.split(,).sort()
Would result in an array containing the days of the week sorted in
alphabetical order:
["Friday","Monday","Saturday","Sunday","Thursday","Tuesday","Wednesday"]
To output a value from an array you can either select a specific value depending on its position in the list (with the first position treated as zero). For example:
value.split(",")[0]
Would extract the first value from the array created by the split
function. In the above example this would be "Monday"
You can also join arrays together to make a String. The GREL expression would look like:
value.split(",").sort().join(",")
Taking the above example again, this would result in a string with the days of the week in alphabetical order, listed with commas between each day.
Exercise 8: Splitting up the shelfmarks data
- Note that the shelfmark data is of the form
library code location(e.g.British Library HMNTS 12641.b.30.). Make three new columns that contains each piece of information. Be sure to join the libary information back together. - Did anything go wrong? How did you check? If there were problems, how might you fix them?
2.4. Regular Expressions
A regular expression (sometimes called a regex) is a way of
representing patterns in text strings. These can be used to search
for text that matches the pattern represented by the regular
expression. Regular expressions typically surrounded by /
characters.
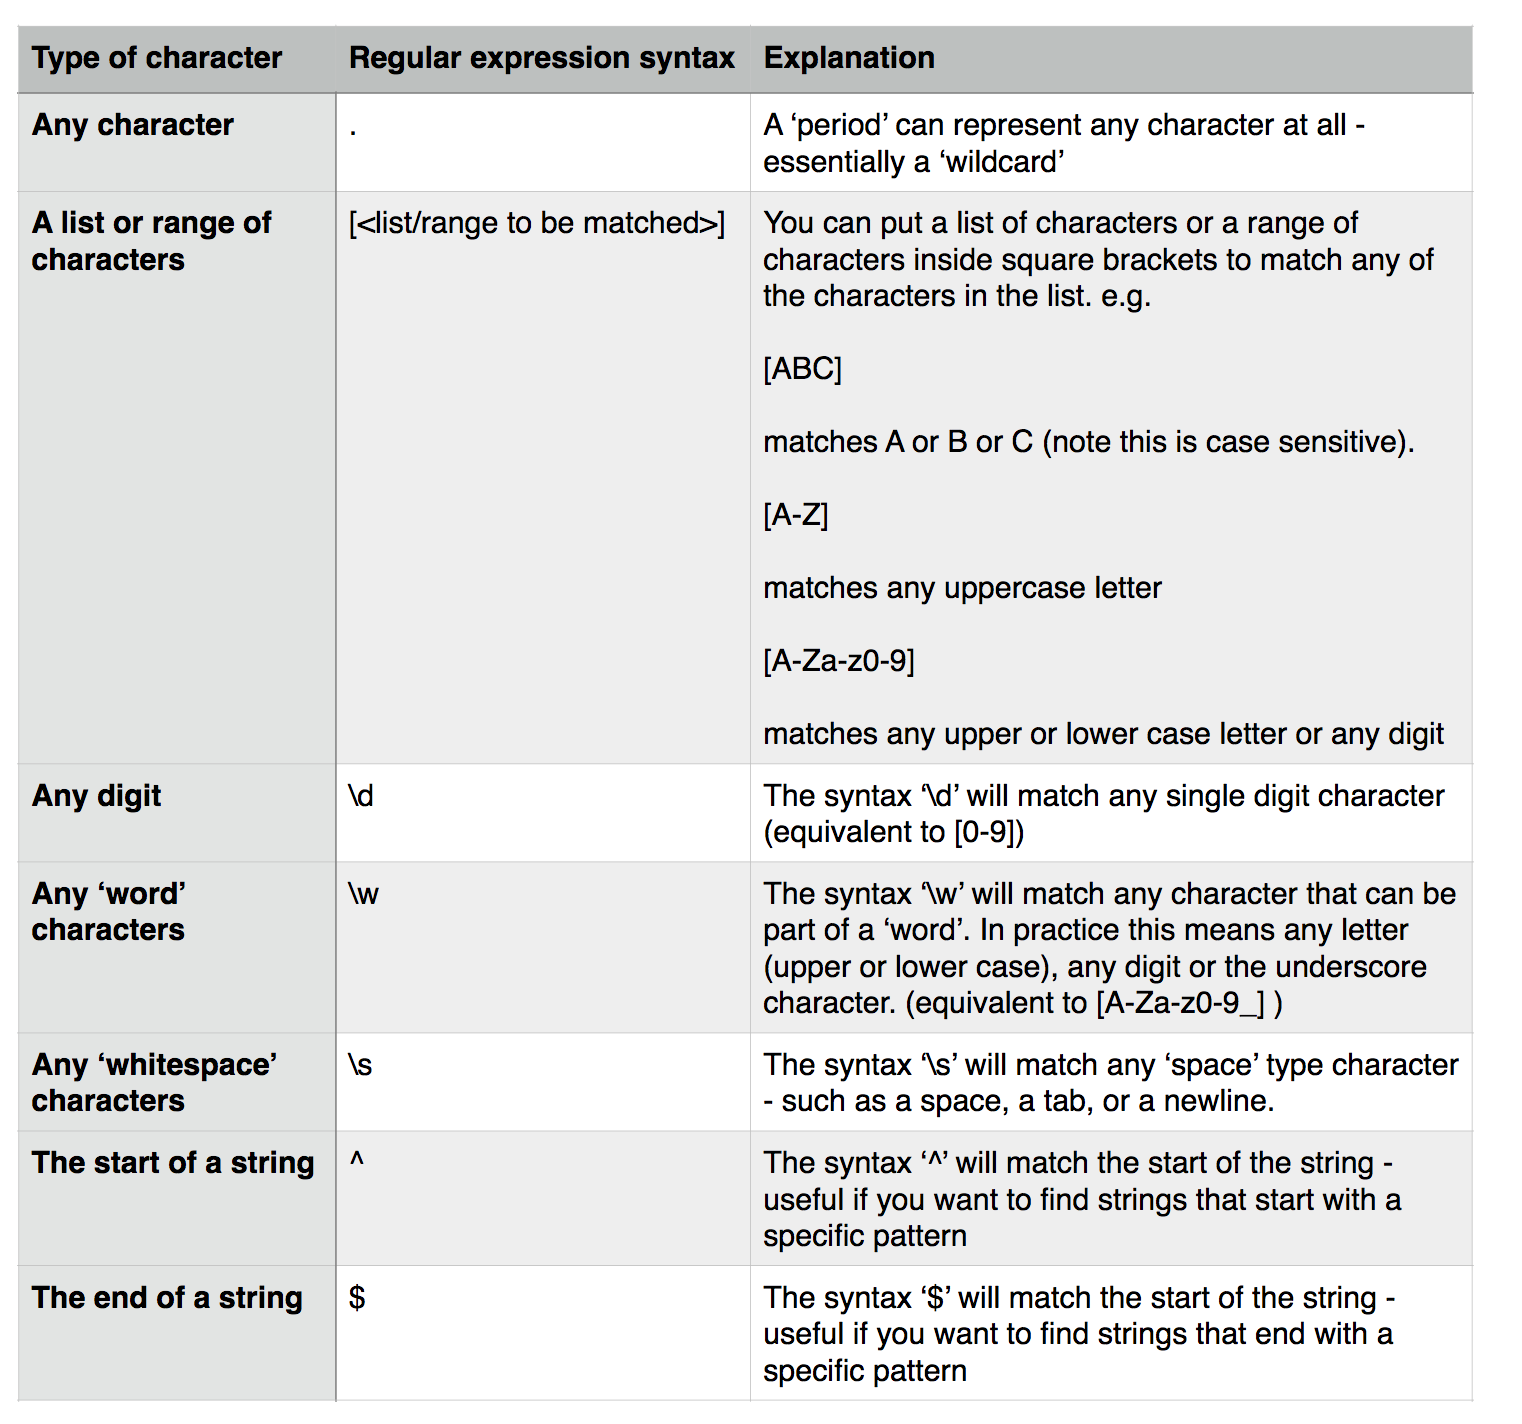
To write a regular expression you need to know the special syntax used to represent different types of characters that can occur in a text string. The table below introduces some of these:
These special characters can be combined with any normal characters
to form a regular expression. So to find both the s and z
spellings of organize/organise) could be:
/organi.e/
Here the . character can represent any character and so this would
match both organise and organize. Because . can represent any
character this could also catch other patterns that might occur. To
be more specific you could use:
/organi[sz]e/
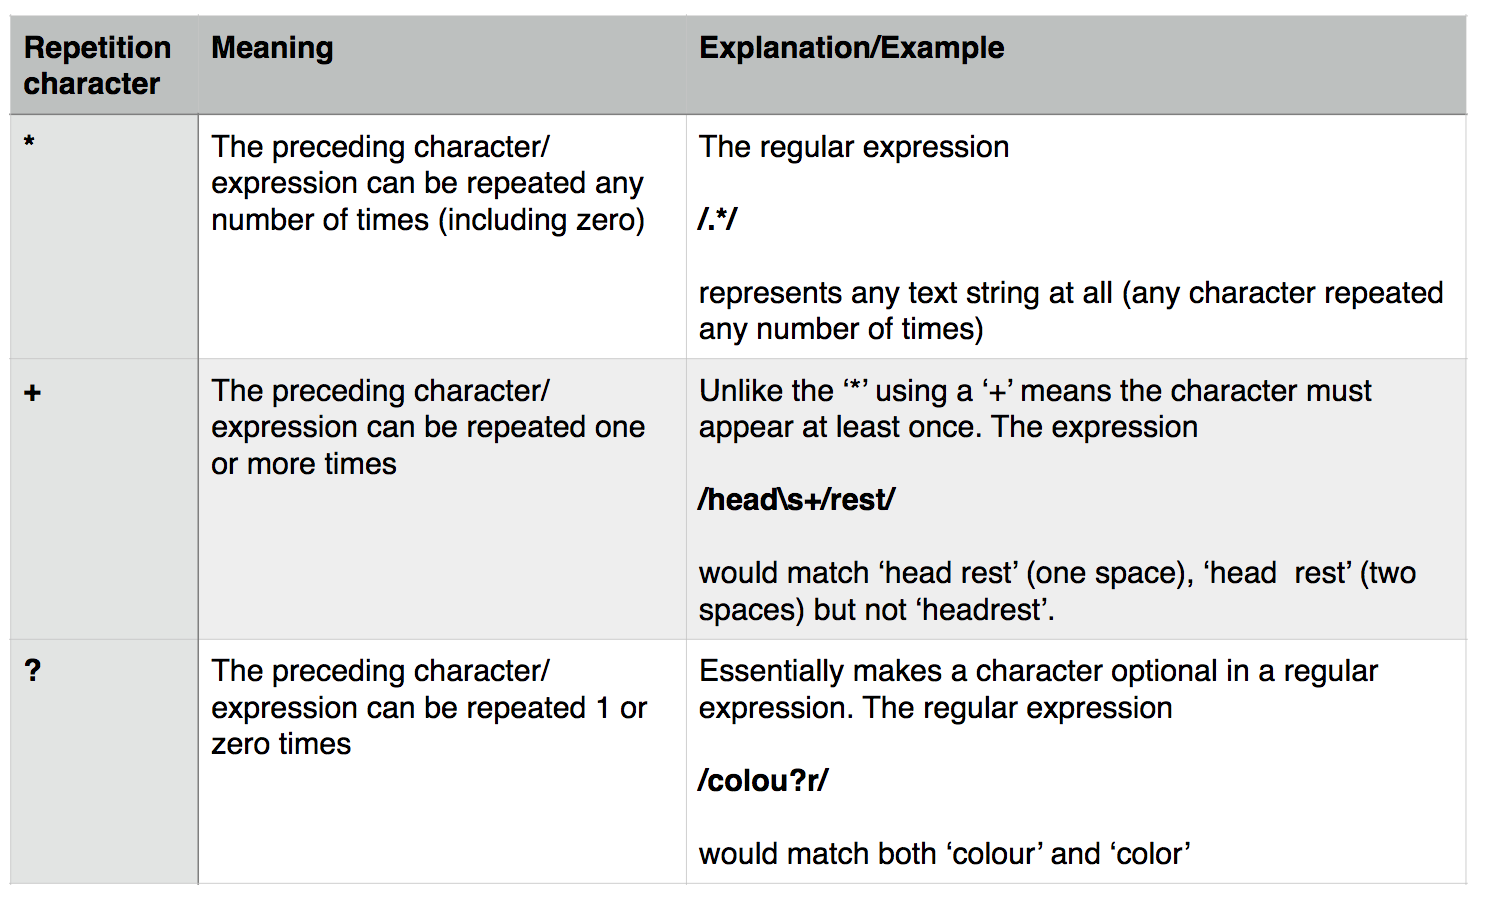
These (and other) character matches can be combined with repetition operators, which allow you to say how many times a character or pattern is repeated. Repetition operators apply to the character or expression immediately preceding the operator. The repetition operations are:
In addition you can specify exact numbers of repetitions, or a maximum/minimum number of repetitions using curly brackets containing one or two numbers:
/a{2}/
Matches the letter a appearing twice (i.e. matches aa)
/a{2,4}/
Matches the letter a appearing a minimum of two times or a maximum
of four times (i.e. matches any of aa, aaa, aaaa)
There are many online resources which provide tutorials on using Regular Expressions, including:
- Cheat Sheet
- http://www.regular-expressions.info
- http://software-carpentry.org/v4/regexp/index.html
- http://www.codeproject.com/Articles/939/An-Introduction-to-Regular-Expressions
- http://regex.bastardsbook.com
2.4.1. Using the match transformation with Regular Expressions
Another feature of Regular Expressions is that you can capture
parts of the matched string to do some further work with. In
OpenRefine, this is particularly used with the match function. The
match function allows you to extract particular parts of a string
by using a regular expression which captures parts of the matching
string. To tell the match function which bits of the matched
string you want to capture, you simply surround those parts of the
regular expression with brackets ().
For example, if you have strings like:
pp. 40. G. Bryan & Co: Oxford
pp. 64. W. Cann: Plymouth
pp. 92. Heath Cranton: London
(representing number of pages, publisher and place of publication).
Question
Suppose that we want to match “pp. ” including the space (and nothing
else). What is wrong with using the regular expression /pp. /?
The problem is matching the period! The regular expression /pp. / would not
only match "pp. ", but also strings like "ppa " and "ppz ". Since
. has a special meaning in a regular expression (an character), we need to
escape this character to just match a period. That is, you use \. to
match a period, where putting the forward slash in front of the period is
referred to as escaping the character.
You could use the match function as follows
value.match(/pp\. (d*)\..*/)
This would find the number following pp in each row and put it
into an OpenRefine Array - so for the rows above you would get:
[40]
[64]
[92]
In the match function the regular expression used has to match the full
string, but only the parts of the regular expression in brackets are put into
the array. A more complex example with the same example strings might be:
value.match(/pp\. (\d*)\. (.*):\s*(.*)/)
This has three capture groups - the page number, the publisher and the place of publication - getting the output:
["40", "G. Bryan & Co", "Oxford"]
[ "64", "W. Cann", "Plymouth"]
[ "95", "Erskine Macdonald", "London"]
Task - Find the offending rows
There are a number of rows that have information like that found in the above examples, all stored in the Place of Publication column.
- Place a text filter on the Place of Publication column and search for
pp.. - What information is stored in this field (in addition to the place of publication). Notice that this information is missing from the respective columns.
The last exercise illustrates a common problem when working with data that has been merged from many sources: at least one of the sources has multiple variables stored in one column. This is a clear violation of our golden rule of storing data (one column per variable). Let’s clean this up.
Task - Make a regular expression to capture the information
Make a regular expression that captures all of the following pieces of information.
- The number that follows the
pp. - The publisher
- The place of publication
- The date of publication
2.4.2. Column References
To make use of this information, we will need to reference the Place of
Publication column in expression for other cells (like Publisher).
This will require us to use a column reference. So far, all of our
transformations have started with value, which is reference to the current
value of each respective cell.
GREL also allows us to reference a cell using cell[col_name].value, where
col_name is the name of a column in quotes. For example,
cells["Publisher"].value refers to the value stored in the Publisher
column of each respective cell.
Note
More information about how to reference various values in GREL expression can be found in the Variable documentation.
We can use these references to pull data from one column into another column, which we illustrate in the following task.
Task - Pull the publisher information from the Place of Publication column.
Let’s add the missing publisher information that we identified in the following task. To do this, perform that following steps.
- Make sure that you still have the
pp.text filter in place - Add a cell transformation to the Publisher column.
- Use
cells["Place of Publication].valueto reference the Place of Publication column. - Use
match, the earlier regular expression (e.g./pp. ([xv]i*\. )?(\d*)\. (.*): (.*), \[?(\d*)\??\.?]?/), and indexing to pull out the publisher.
Now you should complete what we have started by following the steps in the next exercise.
Exercise 8: Pull out the other publication information from the above example.
- Use a similar transformation to fill in the date of publication.
- Finally, transform the Place of Publication to exclude the earlier information.
- When you apply the last transformation, all the rows disappear. Why?
- One of the offending rows was the 8th row. Verify that all of the transformations worked.
- Note that the order of our transformations was essential. Why?
Next, use regular expressions to extract the shelfmark code from the Shelfmark columns.
Exercise 9: Extract the shelfmark
Notice that the first few columns of the Shelfmark column have the form
British Library HMNTS 12641.b.30.
- Verify that all lines start with British Library HMNTS using a text filter
with a regular expression.
- Use
matchto create a new column called Shelfmark Code that contains the code (e.g.12641.b.30) - Use
matchto create a new column called Shelfmark Code 1 that contains the first part of code (e.g.12641) - Use
matchto create a new column called Shelfmark Code 1 that contains the second part of code (e.g.b) - Use
matchto create a new column called Shelfmark Code 1 that contains the last part of code (e.g.30)
2.5. Advanced Refine
2.5.1. Looking up data from a URL
OpenRefine can retrieve data from URLs. This can be used in various ways, including looking up additional information from a remote service, based on information in your OpenRefine data.
As an example, you can look up names against the Virtual International Authority File (VIAF), and retrieve additional information such as dates of birth/death and identifiers.
Typically this is a two step process - firstly a step to retrieve data from a remote service, and secondly to extract the relevant information from the data you have retrieved.
To retrieve data from an external source, from the drop down menu at a column heading use the option Edit column -> Add column by fetching URLs.
This will prompt you for a GREL expression to create a URL. Often this would be a URL that uses existing values in your data to build a query.
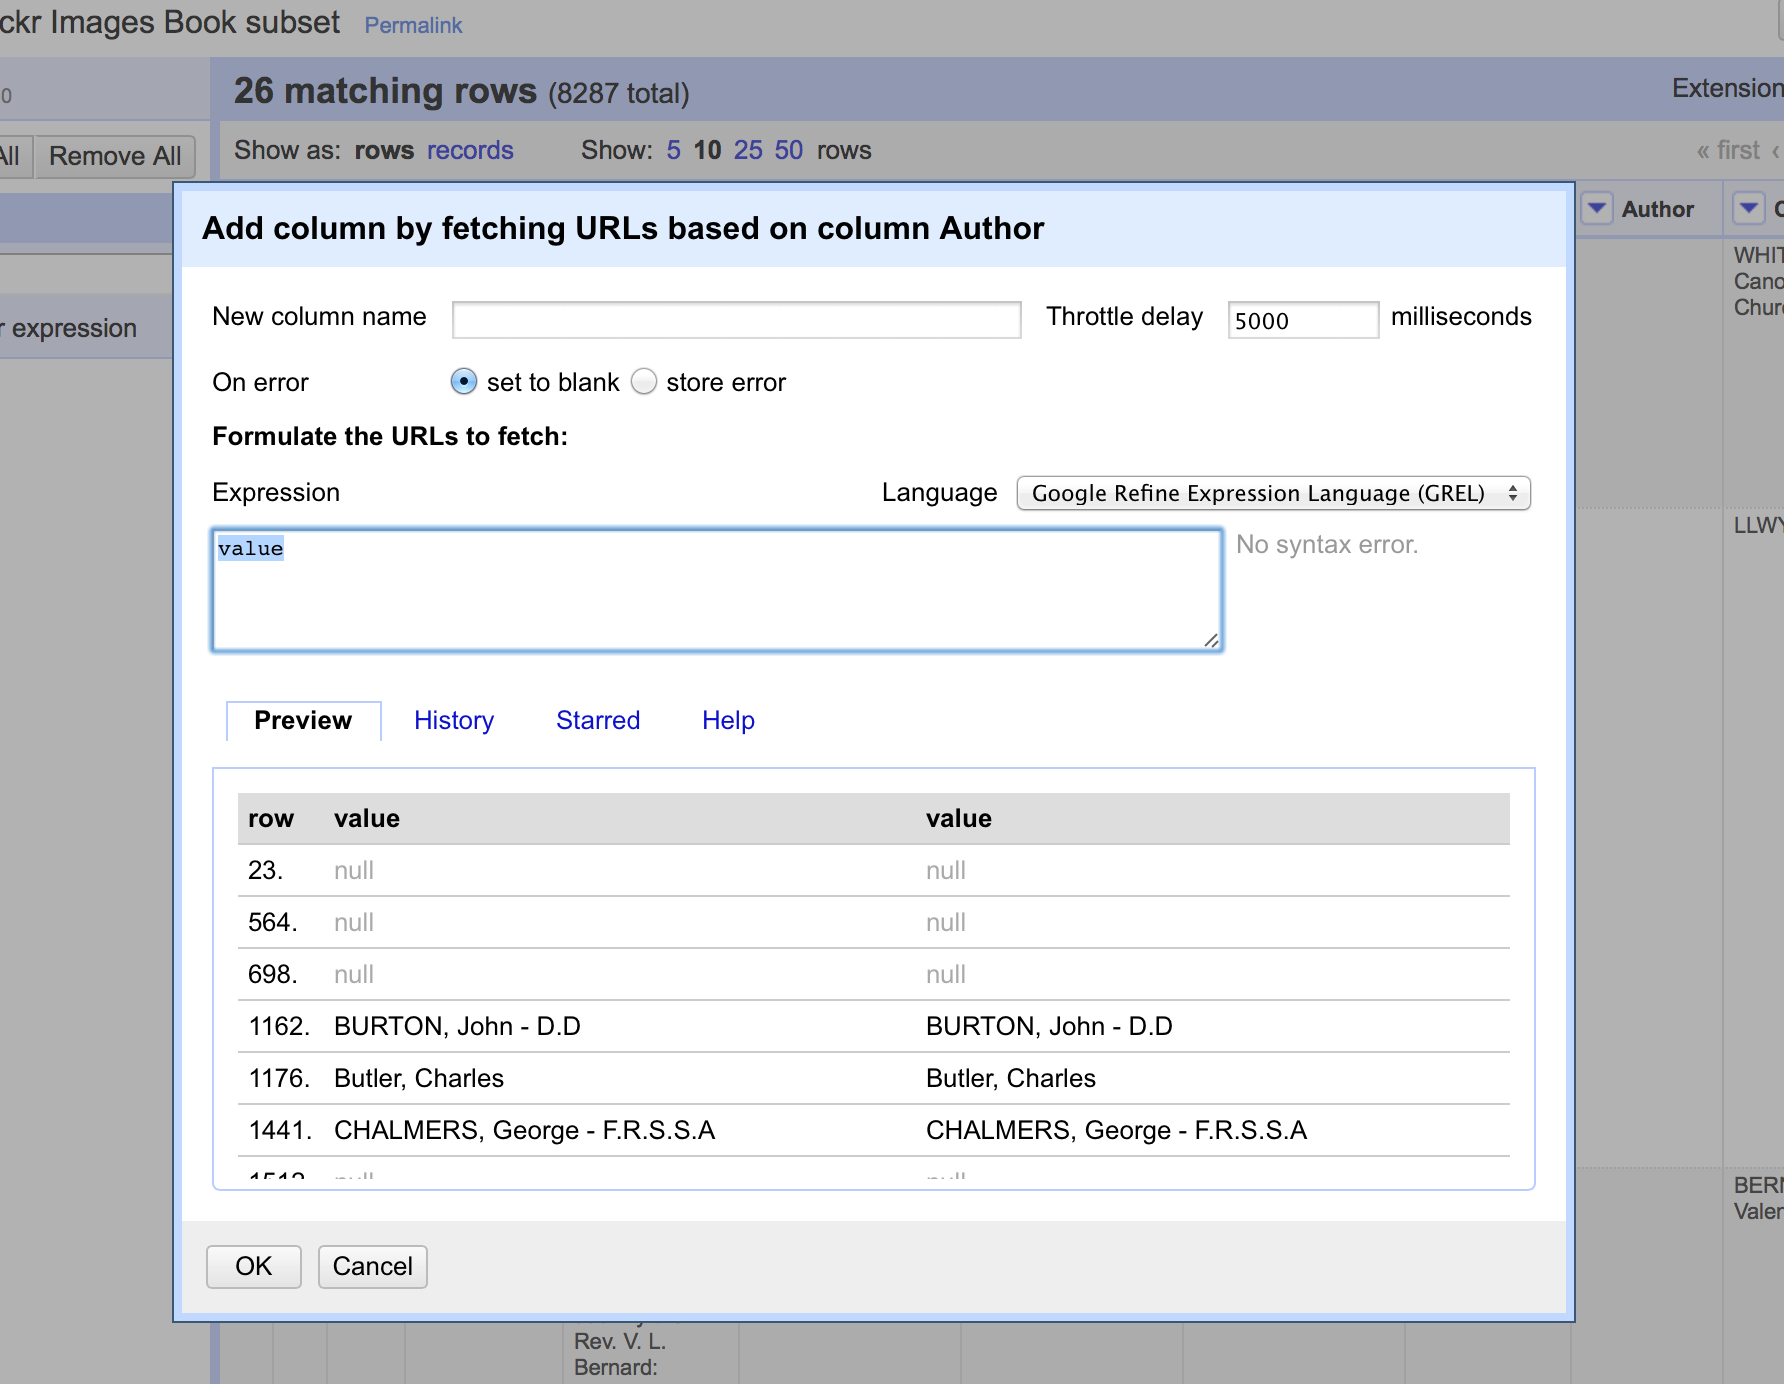
For example if you have a list of Author names, and wish to retrieve information from VIAF you can build a URL by appending the name to the end of a general VIAF URL as follows:
“http://viaf.org/viaf/AutoSuggest?query=”+ escape(value, ‘url’)
(assuming that the column you are working from contains names the value variable will contain the value from the current cell)
This VIAF service returns a list of possible matches in a format called JSON. There is GREL function to extract data from JSON formatted data called parseJSON. This can be used to extract values from the JSON retrieved from VIAF. For example the following expression will extract the first name with a VIAF ID.
forEach(value.parseJson().result, v, v.term + ‘ | ‘ + v.viafid)[0]
The process of retrieving data from external services in this way can be very slow, and is best used on small data sets
2.5.2. Exercise 9: Retrieving VIAF IDs for Authors
- Use the drop down menu at the top of the Date of Publication column and select Text Filter
- Type 1800 into the Date of Publication text filter - this should reduce the number of records you are working with to about 26
- Use the drop down menu at the top of the Author column and select Edit column -> Add column by fetching URLs
- In the New column name box type VIAF JSON
- In the Expression box, type the expression:
- “http://viaf.org/viaf/AutoSuggest?query=”+ escape(value, ‘url’)
- Click OK
- Wait for OpenRefine to retrieve the data from VIAF - this may take a few minutes
- Use the drop down menu at the top of the new VIAF JSON column and select **
- In the Expression box, type the expression:
- forEach(value.parseJson().result, v, v.term + ‘ | ‘ + v.viafid)[0]
This should leave some of the boxes in the column populated with author names and IDs from VIAF.
2.5.3. Reconciliation services
Reconciliation services allow you to lookup terms from your data in OpenRefine against external services, and use values from the external services in your data.
Reconciliation services can be more sophisticated and quicker than using the method described above to retrieve data from a URL. However, to use the Reconciliation function in OpenRefine requires the external resource to support the necessary service for OpenRefine to work with, which means unless the service you wish to use supports such a service you cannot use the Reconciliation approach.
2.5.4. Extensions
The functionality in OpenRefine can be enhanced by extensions which can be downloaded and installed to add functionality to your OpenRefine installation.
A list of Extensions is given at https://github.com/OpenRefine/OpenRefine/wiki/Extensions
One of these extensions tries to work around the limitation of Reconciliation services described above, by making it possible to use a reconciliation service against linked data*1 sources which have SPARQL endpoints2. For more information on this see the *RDF Extension at http:// refine.deri.ie. An example of how this works is given in more detail at http://refine.deri.ie/ showcases.
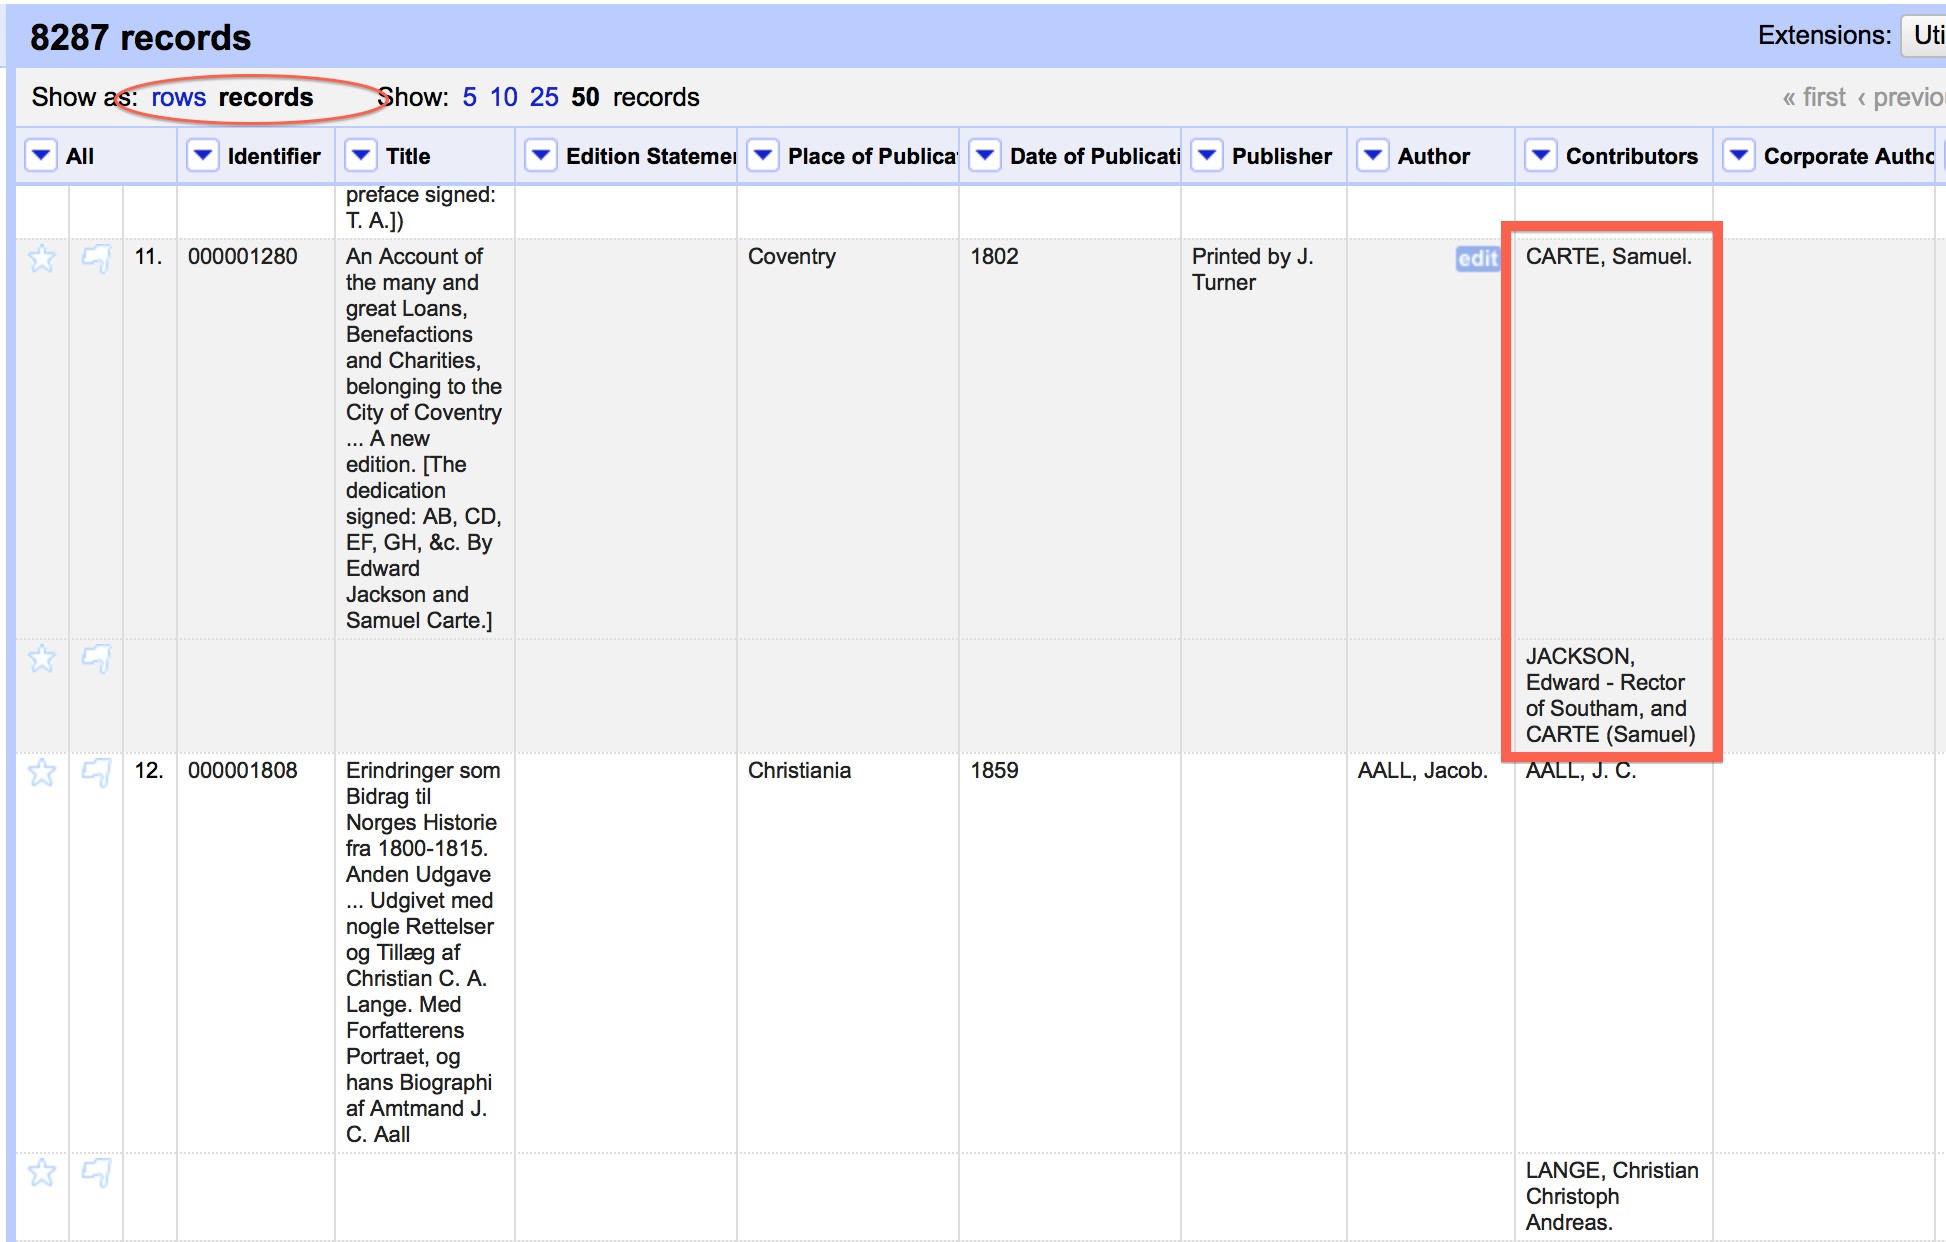
2.5.5. Records and Rows
All the examples above use OpenRefine in Row mode, where it is assumed that each row in the table represents a record.
1 Linked Data is a specific data format that is seeing increased usage in the library and cultural heritage sector Introduction to OpenRefine
2 SPARQL is a language used to query Linked Data and a SPARQL Endpoint is the URL to which such queries can be sent
However, OpenRefine supports a more complex model of Records which allows you to have multiple values for a single column in a single record. For example, it is not unusual for a book to have multiple people (or contributors) involved in the creation of the book.
In the screenshot below you can see the options to select a to Show as rows or records, and also see how row 11 has tow contributors listed.
The records approach is occasionally useful and can be used when you have two rows in the original data set that represent the same thing (book/person/place/etc.) and wish to merge the two rows into a single row, preserving information from both original rows.
For more information on how you can create Records in OpenRefine see http://googlerefine.blogspot.co.uk/2012/06/create-records-in-google-refine.html
2.5.6. Using the cross function to lookup data in other OpenRefine projects
As well as looking up data in external systems using the methods described above, it is also
possible to look up data in other OpenRefine projects on the same computer. This is done using the cross function.
The cross function takes a value from the OpenRefine project you are working on, and looks for that value in a column in another OpenRefine project. If it finds one or more matching rows in the second OpenRefine project, it returns an array containing the rows that it has matched.
As it returns the whole row for each match, you can use a transformation to extract the values from any of the columns in the
You can use to compare the contents of two OpenRefine projects, or to use data between the two projects.